📅 Mastering DateTime Functions in Pandas for Sales Analysis
PANDAS
kishore Babu Valluri
5/16/20255 min read


When working in the sales domain, time is everything. From tracking daily revenue to forecasting next quarter’s demand, having a solid grip on date and time handling in Pandas is crucial.
In this post, we'll walk through essential DateTime functions in Pandas, tailored specifically for sales data. Whether you're analyzing monthly sales trends or pinpointing end-of-quarter spikes, these tools will supercharge your data analysis skills.
🔧 Getting Started: Sample Data
Before any magic happens, make sure your date columns are in the correct format.
import pandas as pd
import numpy as np
# Set the seed for reproducibility
np.random.seed(42)
# Generate date range for 1 year (2024-05-01 to 2025-04-30)
date_range = pd.date_range(start='2024-05-01', end='2025-04-30', freq='D')
# Simulate number of orders per day (Poisson distribution)
orders_per_day = np.random.poisson(lam=10, size=len(date_range)) # avg 10 orders/day
# Expand dates to match number of orders
order_dates = []
for date, count in zip(date_range, orders_per_day):
order_dates.extend([date] * count)
# Build DataFrame
df = pd.DataFrame({
'Order_Date': order_dates,
'Order_ID': range(1, len(order_dates) + 1),
'Customer_ID': np.random.randint(1000, 2000, size=len(order_dates)),
'Revenue': np.round(np.random.uniform(20, 500, size=len(order_dates)), 2)
})
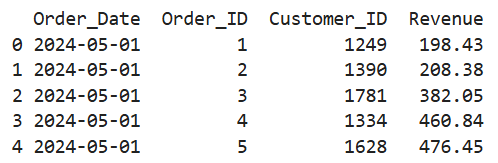
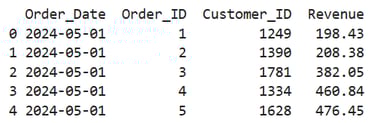
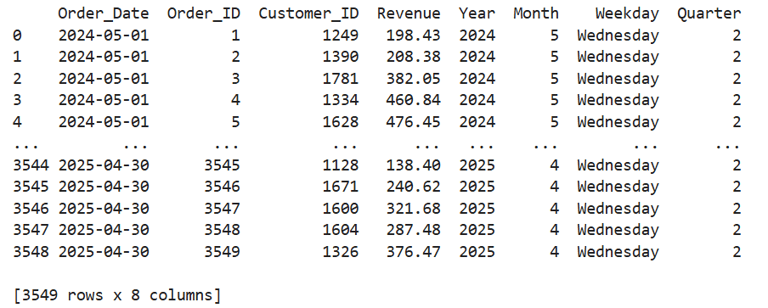
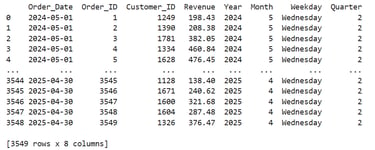
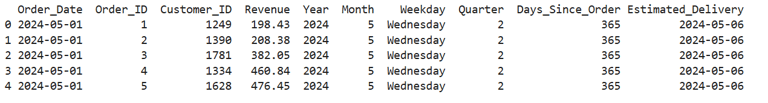
# Preview
print(df.head())
✅ Tip: Use errors='coerce' if there are messy date entries—Pandas will convert invalid formats to NaT.
Converting to DateTime
df['Order_Date']=pd.to_datetime(df['Order_Date'])
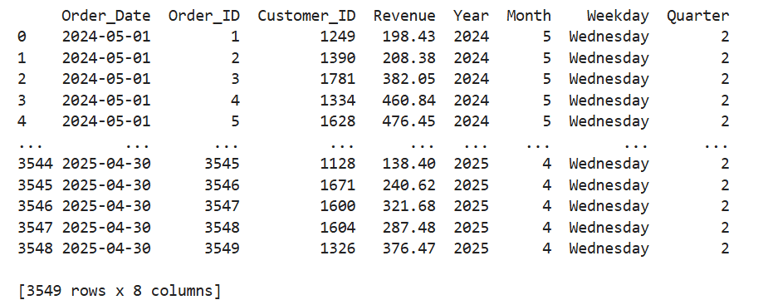
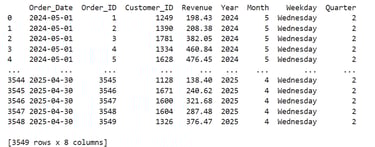
📆 Extracting Date Components
Now let’s extract useful parts of the date, such as month, weekday, or quarter.
import matplotlib.pyplot as plt
df['Year'] = df['Order_Date'].dt.year
df['Month'] = df['Order_Date'].dt.month
df['Weekday'] = df['Order_Date'].dt.day_name()
df['Quarter'] = df['Order_Date'].dt.quarter
print(df)
🔍 Use Case: Want to see which months or quarters drive the most revenue? These fields make it easy.
📊 Grouping Sales by Time Period
One of the most powerful tools is grouping your sales data by date features.
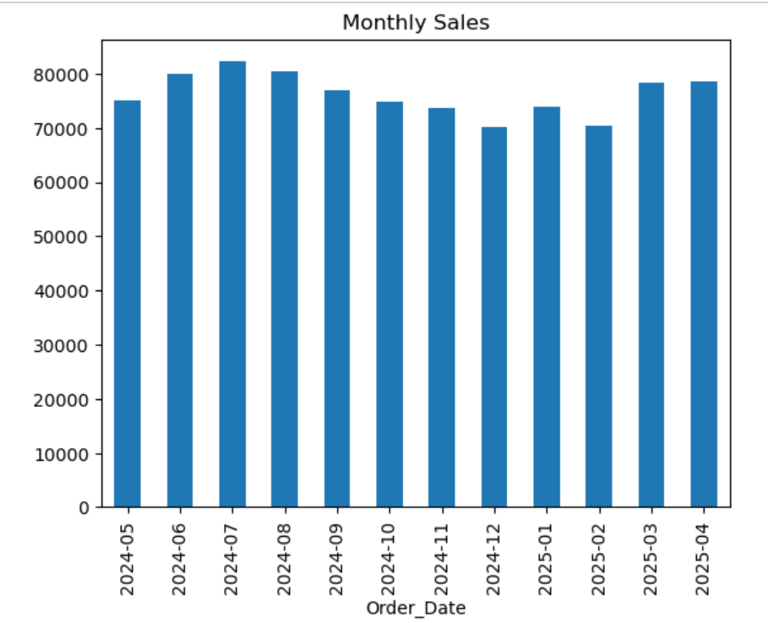
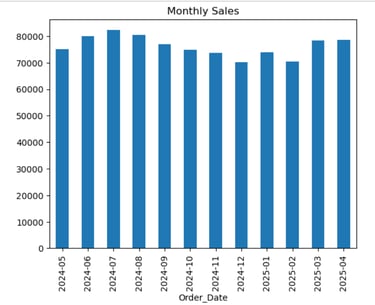
➤ Monthly Sales Trend
monthly_sales = df.groupby(df['Order_Date'].dt.to_period('M'))['Revenue'].sum()
monthly_sales.plot(kind='bar', title='Monthly Sales')
✅ to_period('M') helps group by month, keeping your timeline neat and consistent.
⏱️ Time-Based Filtering
Need to analyze sales from last month or only weekend sales?
➤ Filter by date range
df1=df[(df['Order_Date'] >= '2025-02-01') & (df['Order_Date'] <= '2025-02-28')]
print(df1)
➤ Filter only weekends
df[df['Order_Date'].dt.weekday >= 5]
print(df.head(10))
🕒 Date Offsets and Time Deltas
Want to calculate days since order or project delivery dates?
from datetime import datetime
df['Days_Since_Order'] = (pd.Timestamp('2025-05-01') - df['Order_Date']).dt.days
df['Estimated_Delivery'] = df['Order_Date'] + pd.Timedelta(days=5)
print(df.head())
This is perfect for tracking order fulfillment or logistics timelines.
🔁 Resampling: Aggregating Time Series
Resampling lets you change the frequency of your time series data.
# Set datetime as index
df.set_index('Order_Date', inplace=True)
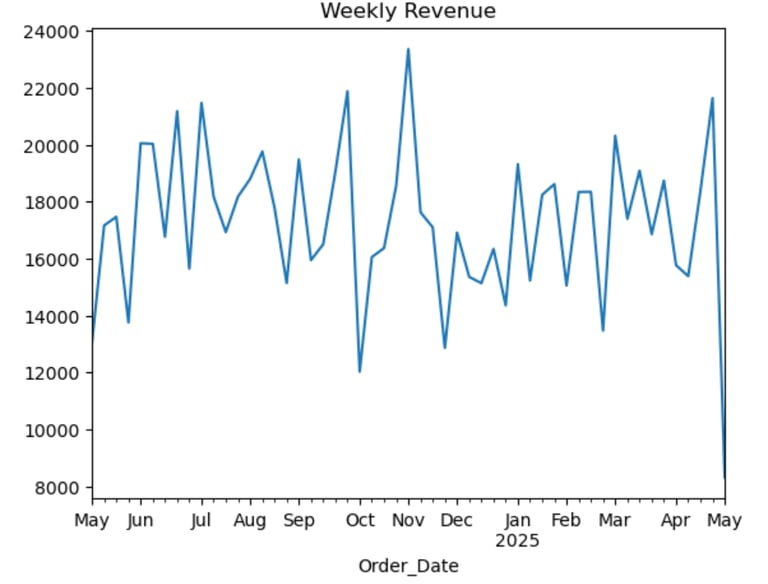
# Weekly revenue trend
weekly = df['Revenue'].resample('W').sum()
weekly.plot(title='Weekly Revenue')
📌 Use resampling for time series forecasting, anomaly detection, or smoothing out noisy sales data.

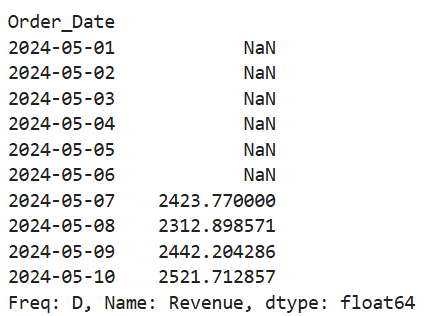
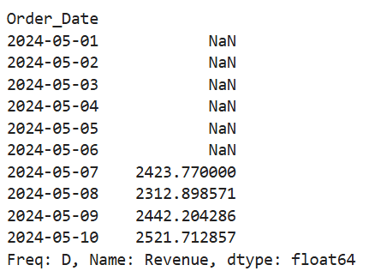
📅 Rolling Windows: Moving Averages
Want to show a 7-day moving average for sales?
rolling_avg = df['Revenue'].resample('D').sum().rolling(window=7).mean()
rolling_avg.head(10)
rolling_avg.plot(title='7-Day Moving Average Revenue')
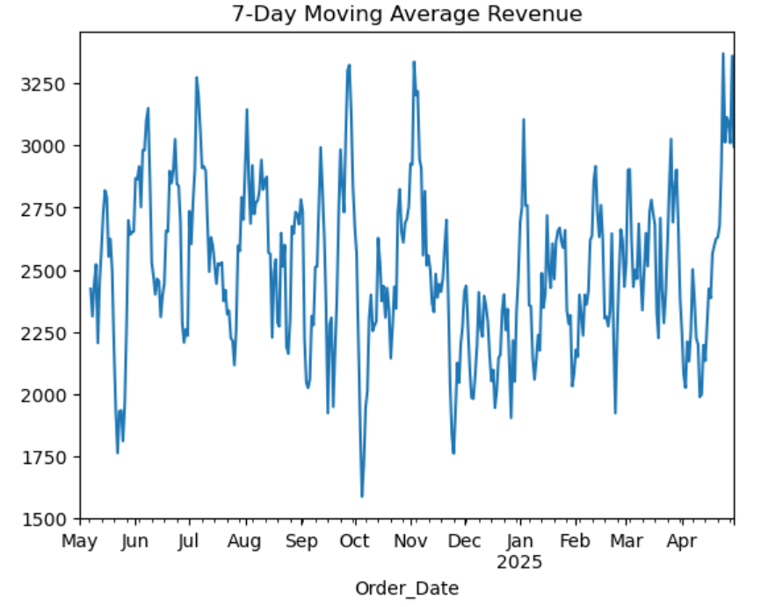
This smooths short-term fluctuations and highlights longer-term trends—ideal for executive dashboards.
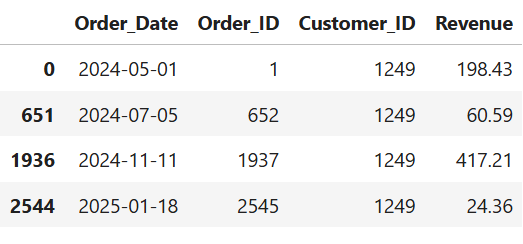
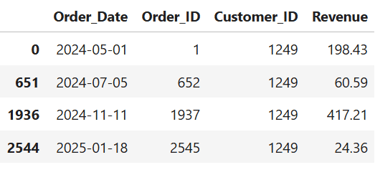
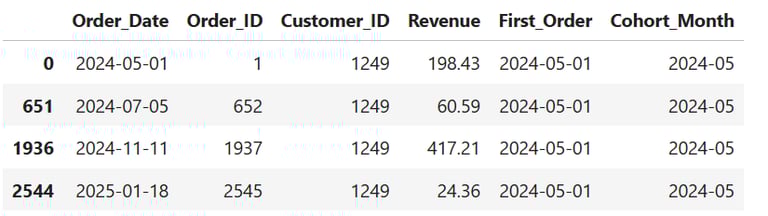
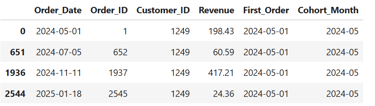
📦 Sales Cohort Analysis by Month
Understand when customers placed their first purchase to group them into acquisition cohorts.
Original Data:
df[df['Customer_ID']==1249]
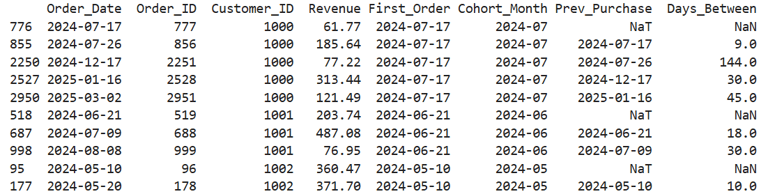
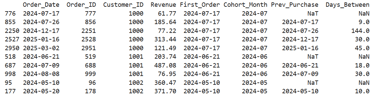
⌛ Time Between Purchases
Track the number of days between purchases to analyze purchase frequency.
Great for calculating purchase intervals and predicting reorders.
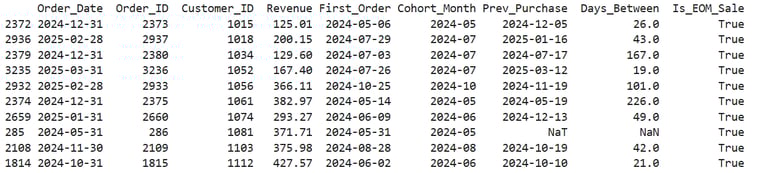
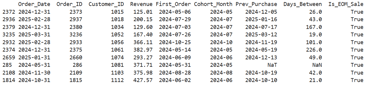
df.sort_values(by=['Customer_ID', 'Order_Date'], inplace=True)
df['Prev_Purchase'] = df.groupby('Customer_ID')['Order_Date'].shift(1)
df['Days_Between'] = (df['Order_Date'] - df['Prev_Purchase']).dt.days
print(df.head(10))
🏁 Flagging End of Month Sales
Some businesses report end-of-month sales surges—this helps capture that.
Filter or analyze only df[df['Is_EOM_Sale']] to see last-day rush sales.
📆 Quarter Start & End Flags
Analyze if certain campaigns succeed better at the start or end of quarters.
🎯 Helps time marketing emails, discounts, or sales pushes.
🔄 Calculate Time to Delivery or Fulfillment Lag
Sales teams often track how long it takes to fulfill an order.
🚚 Useful for logistics optimization or SLA tracking.
# Sample: Delivery_Date column
df['Delivery_Date'] = pd.to_datetime(df['Delivery_Date'])
df['Fulfillment_Days'] = (df['Delivery_Date'] - df['Order_Date']).dt.days
📅 Create a Full Daily Sales Timeline (Even with Missing Dates)
Helpful for time series visualization or filling in gaps with zeros.
📈 This ensures your plots don’t skip weekends or holidays with no sales.
# Set Order_Date as index
df.set_index('Order_Date', inplace=True)
# Daily range from min to max date
full_range = pd.date_range(df.index.min(), df.index.max())
# Reindex and fill missing dates
daily_sales = df['Revenue'].resample('D').sum().reindex(full_range, fill_value=0)
🛍️ Identify First Purchase of the Day (Per Store)
In retail, the first sale of the day is sometimes tracked for staffing or trends.
🏪 Helps determine store open time activity or morning vs evening traffic.
🧾 Tagging Holidays or Weekends
Sales may spike or drop on public holidays or weekends.
🎉 Now you can split performance by holiday vs non-holiday, or adjust promotions accordingly.
import holidays
# US holidays
us_holidays = holidays.US()
df['Is_Holiday'] = df['Order_Date'].dt.date.astype('datetime64').isin(us_holidays)
df['Is_Weekend'] = df['Order_Date'].dt.weekday >= 5
📉 Sales Seasonality Tagging
Add seasonal labels (e.g., Winter, Spring) for seasonal trend analysis.
📊 Use it to see which seasons drive the most revenue or product demand.
def get_season(date):
month = date.month
if month in [12, 1, 2]: return 'Winter'
elif month in [3, 4, 5]: return 'Spring'
elif month in [6, 7, 8]: return 'Summer'
else: return 'Fall'
df['Season'] = df['Order_Date'].apply(get_season)
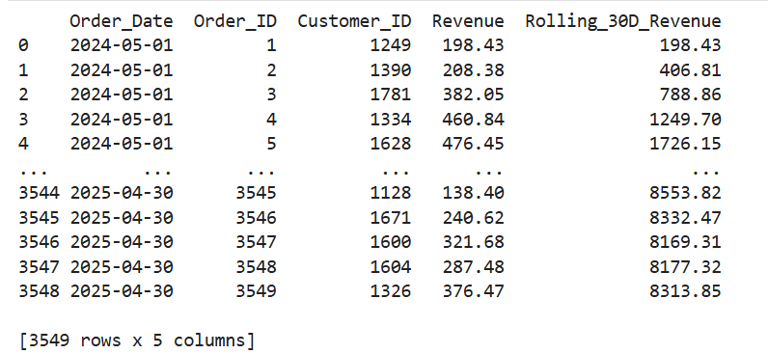
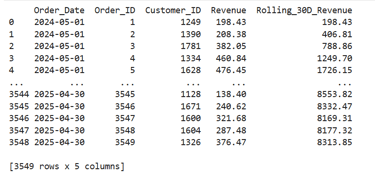
📍 Calculate Rolling Revenue with a Custom Window
E.g., a 30-day rolling revenue total for trend smoothing.
🎢 Helps visualize short-term vs long-term sales momentum.
df['Rolling_30D_Revenue'] = df['Revenue'].rolling(window=30, min_periods=1).sum()

Kishore Babu Valluri
Senior Data Scientist | Freelance Consultant | AI/ML & GenAI Expert
With deep expertise in machine learning, artificial intelligence, and Generative AI, I work as a Senior Data Scientist, freelance consultant, and AI agent developer. I help businesses unlock value through intelligent automation, predictive modeling, and cutting-edge AI solutions.
Summary:
Pandas' DateTime functions are essential for extracting insights from sales data, enabling powerful time-based grouping, filtering, and trend analysis.
With just a few lines of code, you can analyze sales by month, weekday, season, or customer cohorts.
Resampling, rolling averages, and time deltas help reveal trends, seasonality, and operational bottlenecks like delivery delays.
Mastering these tools empowers sales teams to make data-driven decisions, forecast demand, and improve customer retention.
Let's Get in Touch
marketing@deepaiautomation.com
+91 6309397994
© 2025. All rights reserved.
Industries
Manufacturing
Financial Services
Retail
Solutions
DocuMind AI - Intelligent Document Migration
InsightEdge AI - Intelligent Power BI Reporting & Analytics
DCT AI - Digital Control Tower for Intelligent Enterprise Visibility
Inventra AI - Intelligent Inventory Optimization Platform
Maintenix AI - Predictive Maintenance Intelligence Platform
PayPredict AI - Intelligent Customer Payment Prediction Platform
SegMind AI - Intelligent Customer Segmentation & RFM Analytics Platform
DataForge AI - Intelligent ETL & Analytics Modernization Platform
DataSense AI - Intelligent Data Quality & Outlier Detection Agent