📈 Mastering idxmax() in Pandas with Real-World Examples
PANDAS
5/3/20253 min read


When analyzing data in Python using pandas, it's common to need the index (or label) of the row or column where the maximum value occurs. That’s exactly where idxmax() shines.
Let’s explore how idxmax() works and walk through several real-life examples where it becomes a powerful tool in your data analysis toolkit.
🧠 What Does idxmax() Do?
The idxmax() function returns the index (row or column label) of the first occurrence of the maximum value along a given axis.
Syntax:
python
CopyEdit
DataFrame.idxmax(axis=0, skipna=True)
axis=0 (default): returns the index of the max value for each column
axis=1: returns the column label of the max value for each row
skipna=True: ignores NaNs
🔧 Setup: Sample Dataset
We'll use a few real-world inspired datasets.
import pandas as pd
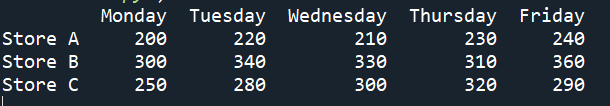
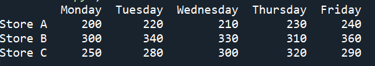
# Example 1: Sales data for a week
data = {
'Monday': [200, 300, 250],
'Tuesday': [220, 340, 280],
'Wednesday': [210, 330, 300],
'Thursday': [230, 310, 320],
'Friday': [240, 360, 290]
}
df = pd.DataFrame(data, index=['Store A', 'Store B', 'Store C'])
print(df)
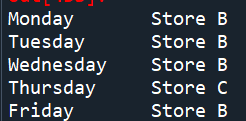
✅ Example 1: Which store had the highest sales each day?
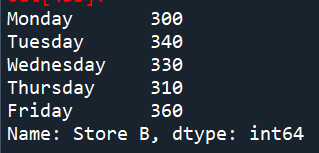
df.idxmax()
📌 Result: Returns which store had the max sales for each day.

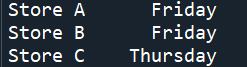
✅ Example 2: On which day did each store have their best performance?
df.idxmax(axis=1)
📌 Result: Returns the day each store achieved its highest sales.

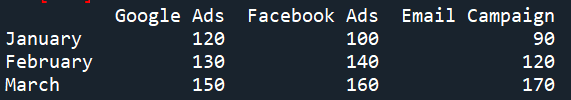
📊 Real-World Example 4: Best Performing Marketing Channel
# Conversion data from different channels
conversions = pd.DataFrame({
'Google Ads': [120, 130, 150],
'Facebook Ads': [100, 140, 160],
'Email Campaign': [90, 120, 170]
}, index=['January', 'February', 'March'])
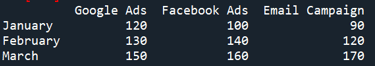
# Which channel performed best each month?
conversions.idxmax(axis=1)
📌 Great for marketers comparing campaigns by time period.
Combine with loc for Full Row Access
✅ Example 3:Find row with highest sales on Friday
max_store_friday = df['Friday'].idxmax()
df.loc[max_store_friday]
📌 This gives you the entire row (i.e., the full week's sales) for the store with the highest sales on Friday.


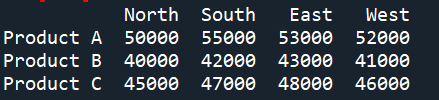
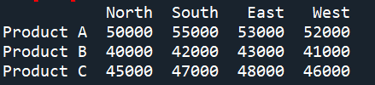
🏦 Example 4: Highest Revenue Product by Region
revenue = pd.DataFrame({
'North': [50000, 40000, 45000],
'South': [55000, 42000, 47000],
'East': [53000, 43000, 48000],
'West': [52000, 41000, 46000]
}, index=['Product A', 'Product B', 'Product C'])
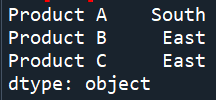
# Which region has the highest revenue for each product?
revenue.idxmax(axis=1)
📌 Helps in identifying strong regional markets per product.
🚨 Gotchas with idxmax()
Multiple max values? idxmax() only returns the first occurrence.
NaNs? Handled by default with skipna=True, but be aware if you disable it.
If all values are NaN, it raises a ValueError.
✨ Summary
idxmax() is simple but immensely useful in real data analysis tasks — from finding top-performing regions, stores, products, to summarizing peaks across time or groups. It’s an essential part of any pandas analyst’s toolkit.

Kishore Babu Valluri
Senior Data Scientist | Freelance Consultant | AI/ML & GenAI Expert
With deep expertise in machine learning, artificial intelligence, and Generative AI, I work as a Senior Data Scientist, freelance consultant, and AI agent developer. I help businesses unlock value through intelligent automation, predictive modeling, and cutting-edge AI solutions.
Let's Get in Touch
marketing@deepaiautomation.com
+91 6309397994
© 2025. All rights reserved.
Industries
Manufacturing
Financial Services
Retail
Solutions
DocuMind AI - Intelligent Document Migration
InsightEdge AI - Intelligent Power BI Reporting & Analytics
DCT AI - Digital Control Tower for Intelligent Enterprise Visibility
Inventra AI - Intelligent Inventory Optimization Platform
Maintenix AI - Predictive Maintenance Intelligence Platform
PayPredict AI - Intelligent Customer Payment Prediction Platform
SegMind AI - Intelligent Customer Segmentation & RFM Analytics Platform
DataForge AI - Intelligent ETL & Analytics Modernization Platform
DataSense AI - Intelligent Data Quality & Outlier Detection Agent