Identifying SKU Divergence Across RDCs Using Clustering
7/30/20252 min read
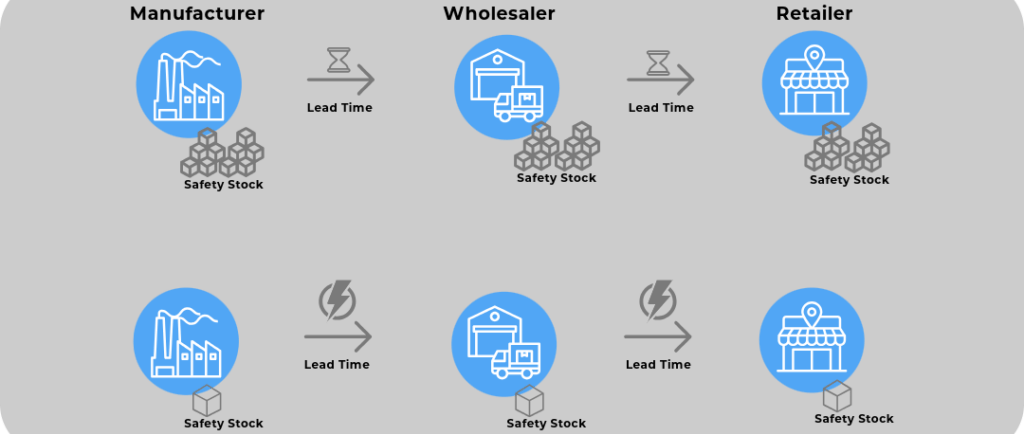
Why Traditional Classification Isn't Enough
If you're managing a regional or global supply chain, you're probably already using ABC and FMS classifications to optimize inventory. These methods are helpful, but they fall short when trying to answer questions like:
Why is this SKU a top performer in one RDC but underperforming in others?
How do I detect divergence without manually checking each region’s performance?
What Is Clustering and Why Use It?
Clustering is a machine learning technique that groups similar data points together — without requiring you to define the groups upfront. It’s perfect for situations where:
You don’t know how many types of performance patterns exist.
You want to detect anomalies or “outlier” SKUs.
You want to find natural groupings of SKUs across RDCs based on their classification patterns.
How to Detect SKU Divergence with Clustering
Here’s how you can do it using Python and common data science tools like pandas and scikit-learn.
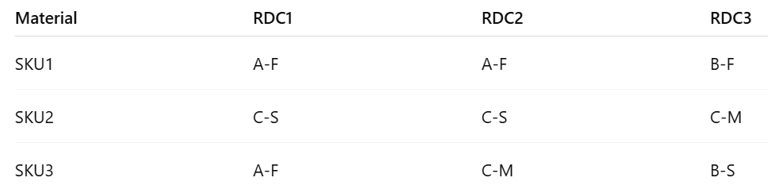
1.Collect ABC-FMS Classification Data
Prepare your matrix with ABC-FMS data per RDC:
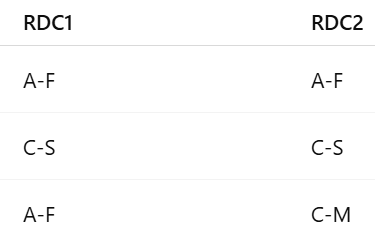
2.Encode the ABC-FMS Data
Split and encode each classification:
from sklearn.preprocessing import OrdinalEncoder
import pandas as pd
# Sample data
df = pd.DataFrame({
'material': ['SKU1', 'SKU2', 'SKU3'],
'RDC1': ['A-F', 'C-S', 'A-F'],
'RDC2': ['A-F', 'C-S', 'C-M'],
'RDC3': ['B-F', 'C-M', 'B-S']
})
# Melt to long format
long_df = df.melt(id_vars='material', var_name='RDC', value_name='ABC_FMS')
long_df[['ABC', 'FMS']] = long_df['ABC_FMS'].str.split('-', expand=True)
# Encode ABC and FMS
encoder = OrdinalEncoder(categories=[['C', 'B', 'A'], ['S', 'M', 'F']])
long_df[['ABC_enc', 'FMS_enc']] = encoder.fit_transform(long_df[['ABC', 'FMS']])
# Pivot to get a feature vector per SKU (each RDC becomes two features)
pivot_df = long_df.pivot(index='material', columns='RDC', values=['ABC_enc', 'FMS_enc'])
pivot_df.columns = [f'{i}_{j}' for i, j in pivot_df.columns]
pivot_df.reset_index(inplace=True)
3.Apply Clustering (e.g., K-Means)
from sklearn.cluster import KMeans
X = pivot_df.drop(columns=['material'])
kmeans = KMeans(n_clusters=3, random_state=42)
pivot_df['Cluster'] = kmeans.fit_predict(X)
Now, each SKU is grouped based on how similarly it behaves across RDCs.
4.Identify Divergent SKUs
The trick: look for clusters with very few SKUs — these are your outliers or divergent items.
sku_counts = pivot_df['Cluster'].value_counts()
pivot_df['Cluster_Size'] = pivot_df['Cluster'].map(sku_counts)
# Flag small clusters as divergent
pivot_df['Flag'] = pivot_df['Cluster_Size'].apply(
lambda x: 'Divergent' if x <= 2 else 'Typical'
)
5.Visualization: Understand the Groupings
You can use PCA or t-SNE to reduce the SKU feature space and plot SKU clusters:
from sklearn.decomposition import PCA
import matplotlib.pyplot as plt
pca = PCA(n_components=2)
components = pca.fit_transform(X)
pivot_df['PC1'] = components[:, 0]
pivot_df['PC2'] = components[:, 1]
plt.figure(figsize=(8, 5))
for cluster in pivot_df['Cluster'].unique():
cluster_data = pivot_df[pivot_df['Cluster'] == cluster]
plt.scatter(cluster_data['PC1'], cluster_data['PC2'], label=f'Cluster {cluster}')
plt.title('SKU Clusters Based on ABC-FMS Patterns')
plt.xlabel('Principal Component 1')
plt.ylabel('Principal Component 2')
plt.legend()
plt.grid(True)
plt.tight_layout()
plt.show()
Business Value
This approach enables:
Smarter inventory segmentation across RDCs
SKU-specific replenishment policies instead of global rules
Early detection of behavioral changes across geographies
Final Thoughts
In an era of demand-driven and decentralized inventory, static ABC-FMS classifications are no longer enough.
Clustering gives you the power to detect divergence automatically, helping you drive more localized, intelligent inventory decisions.
Let's Get in Touch
marketing@deepaiautomation.com
+91 6309397994
© 2025. All rights reserved.
Industries
Manufacturing
Financial Services
Retail
Solutions
DocuMind AI - Intelligent Document Migration
InsightEdge AI - Intelligent Power BI Reporting & Analytics
DCT AI - Digital Control Tower for Intelligent Enterprise Visibility
Inventra AI - Intelligent Inventory Optimization Platform
Maintenix AI - Predictive Maintenance Intelligence Platform
PayPredict AI - Intelligent Customer Payment Prediction Platform
SegMind AI - Intelligent Customer Segmentation & RFM Analytics Platform
DataForge AI - Intelligent ETL & Analytics Modernization Platform
DataSense AI - Intelligent Data Quality & Outlier Detection Agent