Identifying SKU Divergence Across Regional Distribution Centers (RDCs) Using ABC and FMS Classification
7/25/20252 min read
In today’s multi-node supply chains, one-size-fits-all inventory policies no longer work. A product that moves rapidly in one region may sit idle in another. To tackle this, smart supply chains use ABC and FMS classification — but often overlook the inconsistencies between regions that can undermine planning.
In this post, we'll explore how to use ABC-FMS divergence analysis to pinpoint SKUs with contrasting performance across RDCs, and why this matters for demand-driven, cost-effective operations.
What Are ABC and FMS Classifications?
ABC Analysis categorizes SKUs based on their value contribution (e.g., revenue or volume):
A: High-value, top 20% of SKUs contributing to 80% of value
B: Moderate value
C: Low-value tail items
FMS Analysis categorizes SKUs by their demand behavior:
F (Fast): Frequently picked or ordered
M (Medium): Intermittent or moderate frequency
S (Slow): Rarely ordered, sporadic or erratic
Together, ABC-FMS provides a two-dimensional view of inventory: strategic value and behavior. For example, an A-F SKU is high-value and fast-moving — a prime candidate for tight inventory control and high service levels.
Why SKU Classification Varies by RDC
Demand Patterns Differ: One RDC might serve a region where SKU sells fast (high demand), while another has slower movement.
Customer Base & Preferences: Different customer profiles or sales channels affect SKU velocity.
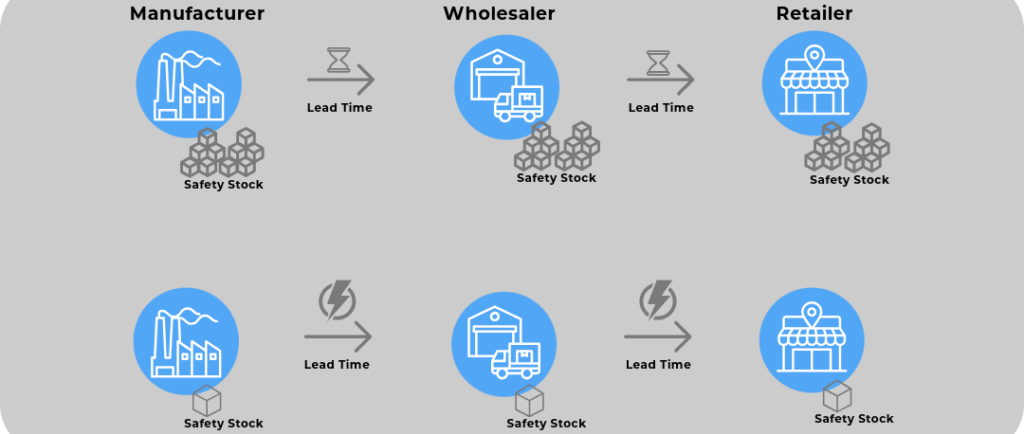
Lead Times & Supply Constraints: Availability and replenishment timing may differ by location.
Sales Promotions & Seasonality: Local marketing or events may boost or dampen SKU demand.
Why Divergence Matters
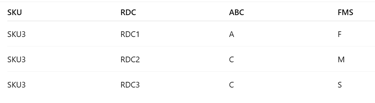
Let’s say a SKU is A-F in RDC1 but C-S in RDC3. That tells us:
It's critical and fast-moving in one region (e.g., urban Northeast)
It’s slow and low-priority elsewhere (e.g., remote South)
Yet, many ERP systems apply the same inventory policy across all RDCs. This results in:
Overstocking in low-demand RDCs
Stockouts in high-demand RDCs
Wasted working capital and frustrated customers
How to Detect SKU Divergence
Here’s a proven method to detect divergence using data:
1. Assign ABC and FMS labels to each SKU

2.Ordinal Encoding
Assign scores:
ABC: A=3, B=2, C=1
FMS: F=3, M=2, S=1
Now each RDC has a numeric representation: (ABC, FMS)
3. Compute Divergence
Use Euclidean distance to measure the spread of classifications:
from scipy.spatial.distance import pdist
def compute_divergence(vectors):
return pdist(vectors, metric='euclidean').max()
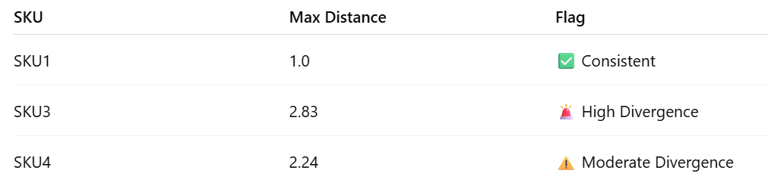
A large distance (e.g., > 2.5) means high divergence.
4. Flag SKUs
Distance < 1.0: Consistent
Distance 1.0–2.5: Moderate Divergence
Distance > 2.5: High Divergence (e.g., A-F vs C-S)
5.Real Business Example
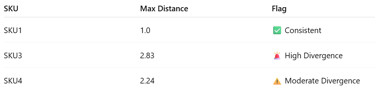
SKU3 deserves special attention: it performs like a hero in one RDC, and a liability in others. Time to:
Reallocate inventory
Adjust stocking policies
Review transfer or fulfillment logic
Why This Matters for Inventory Strategy
Identifying divergence lets you:
✅ Tailor stock levels per region
✅ Improve service levels where demand is high
✅ Reduce waste where demand is low
✅ Enable demand-driven replenishment (DDMRP-ready)
Wrap-Up: From Visibility to Action
ABC and FMS are powerful tools — but their full potential is unlocked when used to detect divergence across RDCs. By applying simple data techniques like encoding and distance metrics, planners can spotlight SKUs that need differentiated treatment.
Don’t just classify your SKUs — compare them across the network. That’s where real optimization begins.
Let's Get in Touch
marketing@deepaiautomation.com
+91 6309397994
© 2025. All rights reserved.
Industries
Manufacturing
Financial Services
Retail
Solutions
DocuMind AI - Intelligent Document Migration
InsightEdge AI - Intelligent Power BI Reporting & Analytics
DCT AI - Digital Control Tower for Intelligent Enterprise Visibility
Inventra AI - Intelligent Inventory Optimization Platform
Maintenix AI - Predictive Maintenance Intelligence Platform
PayPredict AI - Intelligent Customer Payment Prediction Platform
SegMind AI - Intelligent Customer Segmentation & RFM Analytics Platform
DataForge AI - Intelligent ETL & Analytics Modernization Platform
DataSense AI - Intelligent Data Quality & Outlier Detection Agent