Mastering Customer Segmentation: The Critical Business Questions RFM Analysis Can Solve - Implementation
Kishore Babu Valluri
7/5/20253 min read
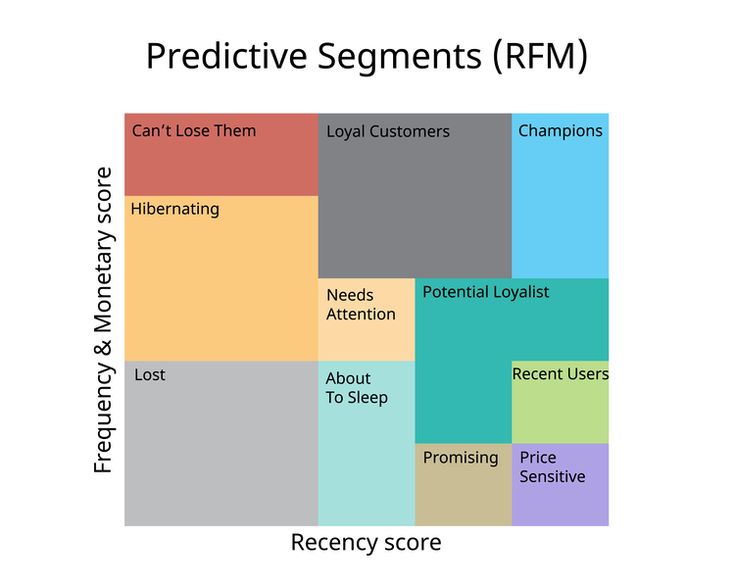
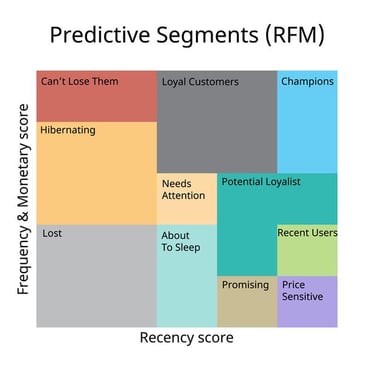
To implement RFM Analysis in Python, you’ll need transaction data (with columns such as Customer ID, Purchase Date, and Amount), which can then be used to calculate Recency, Frequency, and Monetary values for each customer.
Let's assume that the transaction data is in a pandas DataFrame. Below is the Python code to implement the RFM analysis and answer the various business questions:
1. Required Libraries:
import pandas as pd
import numpy as np
from datetime import datetime
import matplotlib.pyplot as plt
import seaborn as sns
2. Calculate Recency, Frequency, and Monetary:
We calculate Recency, Frequency, and Monetary values for each customer.
# Get today's date (most recent transaction date in the data)
today_date = df['TransactionDate'].max() + pd.Timedelta(days=1)
# Recency: Days since last purchase for each customer
recency_df = df.groupby('CustomerID').agg({
'TransactionDate': lambda x: (today_date - x.max()).days
}).rename(columns={'TransactionDate': 'Recency'})
# Frequency: Count of transactions for each customer
frequency_df = df.groupby('CustomerID').agg({
'TransactionDate': 'count'
}).rename(columns={'TransactionDate': 'Frequency'})
# Monetary: Total amount spent by each customer
monetary_df = df.groupby('CustomerID').agg({
'Amount': 'sum'
}).rename(columns={'Amount': 'Monetary'})
# Combine Recency, Frequency, and Monetary into a single DataFrame
rfm_df = recency_df.join(frequency_df).join(monetary_df)
# Display the RFM table
print(rfm_df)
3. Business Questions Implementation:
(1) Which customers are most likely to buy again?
Customers who are recent and frequent buyers are more likely to buy again. We can identify them by looking at the Recency and Frequency values.
# High Frequency & Low Recency -> Most likely to buy again
likely_buy_again = rfm_df[(rfm_df['Frequency'] > 2) & (rfm_df['Recency'] < 30)]
print("Customers likely to buy again:")
print(likely_buy_again)
(2) Who needs to be retargeted or re-engaged?
Customers who have low frequency and high recency are at risk. These are customers who haven't purchased recently.
# High Recency & Low Frequency -> Customers to retarget
at_risk_customers = rfm_df[(rfm_df['Frequency'] <= 1) & (rfm_df['Recency'] > 30)]
print("At risk customers (need retargeting):")
print(at_risk_customers)
(3) Which customers are worth investing more in?
Customers who spend a lot of money and have a high frequency of purchases are worth investing in.
# High Frequency & High Monetary -> Worth investing more in
high_value_customers = rfm_df[(rfm_df['Frequency'] > 2) & (rfm_df['Monetary'] > 400)]
print("Customers worth investing more in:")
print(high_value_customers)
(4) Who are your most loyal and engaged customers?
Customers who frequently make purchases and spend a significant amount of money are the most loyal.
# High Frequency & High Monetary -> Loyal & engaged customers
loyal_customers = rfm_df[(rfm_df['Frequency'] > 3) & (rfm_df['Monetary'] > 300)]
print("Loyal and engaged customers:")
print(loyal_customers)
(5) How do I predict customer churn and retain valuable clients?
Customers who have high recency, low frequency, and low monetary are at risk of churning. These customers need attention.
# High Recency & Low Frequency -> Potential churn
churn_risk = rfm_df[(rfm_df['Frequency'] <= 1) & (rfm_df['Recency'] < 60) & (rfm_df['Monetary'] < 200)]
print("Churn risk customers:")
print(churn_risk)
(6) How can I increase customer lifetime value?
Focus on high-frequency and high-monetary customers and personalize offers to increase their lifetime value.
# High Frequency & High Monetary -> High potential for increased LTV
increase_ltv_customers = rfm_df[(rfm_df['Frequency'] > 3) & (rfm_df['Monetary'] > 300)]
print("Customers with potential for increased LTV:")
print(increase_ltv_customers)
(7) How do I optimize my marketing spend?
Focus your marketing efforts on high-value customers to maximize ROI.
# High Frequency & High Monetary -> Optimize marketing spend
optimize_spend = rfm_df[(rfm_df['Frequency'] > 3) & (rfm_df['Monetary'] > 300)]
print("Customers to focus marketing efforts on:")
print(optimize_spend)
(8) How do I identify seasonal trends or patterns?
You can analyze Recency and Frequency by month or season to identify buying patterns.
# Adding a 'Month' column to check seasonal trends
df['Month'] = df['TransactionDate'].dt.month
# Calculate average spending by month
monthly_spending = df.groupby('Month').agg({
'Amount': 'sum',
'CustomerID': 'nunique'
}).rename(columns={'Amount': 'TotalAmount', 'CustomerID': 'UniqueCustomers'})
print("Monthly spending and customer activity:")
print(monthly_spending)
Visualizations:
To visualize the results, we can create some plots.
# Plot Recency vs Frequency for customers
plt.figure(figsize=(8,6))
sns.scatterplot(data=rfm_df, x='Recency', y='Frequency', hue='Monetary', palette='viridis', size='Monetary', sizes=(20, 200))
plt.title('Recency vs Frequency with Monetary Size')
plt.show()
# Plot customer segments based on Frequency and Monetary
plt.figure(figsize=(8,6))
sns.scatterplot(data=rfm_df, x='Frequency', y='Monetary', hue='Recency', palette='coolwarm')
plt.title('Frequency vs Monetary with Recency Hue')
plt.show()
Conclusion
With this code, you can:
Calculate Recency, Frequency, and Monetary values for each customer.
Answer crucial business questions, such as identifying high-value customers, retargeting at-risk customers, and improving marketing ROI.
Visualize your customer segments and derive actionable insights.
Let's Get in Touch
marketing@deepaiautomation.com
+91 6309397994
© 2025. All rights reserved.
Industries
Manufacturing
Financial Services
Retail
Solutions
DocuMind AI - Intelligent Document Migration
InsightEdge AI - Intelligent Power BI Reporting & Analytics
DCT AI - Digital Control Tower for Intelligent Enterprise Visibility
Inventra AI - Intelligent Inventory Optimization Platform
Maintenix AI - Predictive Maintenance Intelligence Platform
PayPredict AI - Intelligent Customer Payment Prediction Platform
SegMind AI - Intelligent Customer Segmentation & RFM Analytics Platform
DataForge AI - Intelligent ETL & Analytics Modernization Platform
DataSense AI - Intelligent Data Quality & Outlier Detection Agent