Profitability Metrics in Sales Data Analysis with Python - Part2
Blog post description.
10/3/20253 min read


Profitability metrics tell us whether sales are actually creating value for the business. Revenue alone doesn’t guarantee success — we need to measure margins, profits, and returns.
Generate a Sample Sales Dataset
Before diving into KPIs, let’s create a realistic dataset with customers, sales reps, products, regions, and revenues.
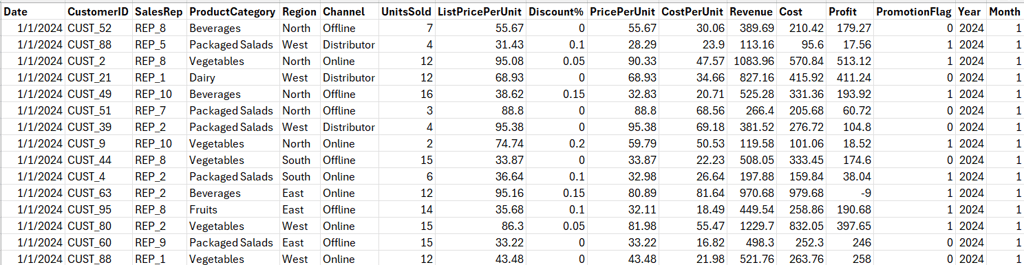
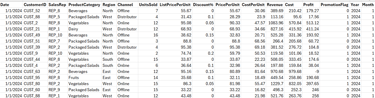
The description of some of the fields are given below:
ListPricePerUnit → Original price before discount
Discount% → Percentage discount applied
CostPerUnit → Cost per unit is the total cost of producing one unit of a product or service.
CostPerUnit=Total Production Cost / Number of Units Produced
PricePerUnit → Final price after discount
PromotionFlag → 1 if the transaction was during a promotion, else 0
Revenue → UnitsSold × PricePerUnit
Cost → UnitsSold × CostPerUnit
Profit → Revenue – Cost
1.Gross Profit
Definition:
The profit after subtracting the direct costs of goods sold (COGS) from total revenue. It measures how efficiently you produce/sell your products.
Formula:
Gross Profit=Revenue−Cost
gross_profit = df["Profit"].sum() # Profit already = Revenue - Cost
print("Gross Profit:", gross_profit)
2.Gross Margin %
Definition:
Shows what percentage of revenue remains after covering COGS. Higher margins means more efficient operations.
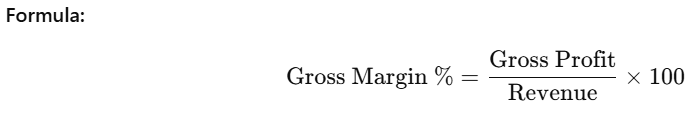

gross_margin_pct = (df["Profit"].sum() / df["Revenue"].sum()) * 100
print("Gross Margin %:", round(gross_margin_pct, 2))
3.Operating Profit
Definition:
Profit after deducting operating expenses (like salaries, rent, marketing). It excludes taxes and financing.
Formula:
Operating Profit=Gross Profit−Operating Expenses
operating_expenses = 0.2 * df["Revenue"].sum() # assume 20% of revenue
operating_profit = df["Profit"].sum() - operating_expenses
print("Operating Profit:", operating_profit)
4.Net Profit
Definition:
The bottom-line profit after subtracting taxes and all expenses. This is the true profitability of the company.
Formula:
Net Profit=Operating Profit−Taxes
taxes = 0.3 * operating_profit # assume 30% tax
net_profit = operating_profit - taxes
print("Net Profit:", net_profit)
5.Net Profit Margin %
Definition:
Percentage of revenue that turns into actual profit after all expenses and taxes.

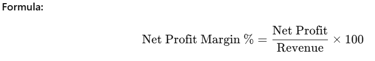
net_profit_margin_pct = (net_profit / df["Revenue"].sum()) * 100
print("Net Profit Margin %:", round(net_profit_margin_pct, 2))
6.Contribution Margin
Definition:
Measures how much revenue is left after variable costs, to cover fixed costs and generate profit. Helps in pricing & product decisions.
Formula:
Contribution Margin=Revenue−(UnitsSold×CostPerUnit)
df["Contribution"] = df["Revenue"] - (df["UnitsSold"] * df["CostPerUnit"])
contribution_margin = df["Contribution"].sum()
print("Contribution Margin:", contribution_margin)
7.Profit per Product
Definition:
Shows the average profit contribution of each product category. Useful for identifying high-margin vs low-margin products.
Formula:
Profit per Unit=Profit / UnitsSold
df["Profit_per_Unit"] = df["Profit"] / df["UnitsSold"]
profit_per_product = df.groupby("ProductCategory")["Profit_per_Unit"].mean()
print(profit_per_product)
8.Break-even Sales Volume
Definition:
The sales volume needed to cover fixed costs. Beyond this point, the company starts making profit.
Formula:
Break-even Volume=Fixed Costs / (PricePerUnit−CostPerUnit)
fixed_costs = 50000
avg_price = df["PricePerUnit"].mean()
avg_cost = df["CostPerUnit"].mean()
break_even_volume = fixed_costs / (avg_price - avg_cost)
print("Break-even Sales Volume:", round(break_even_volume))
9.Return on Sales (ROS)
Definition:
Measures how much profit is generated from each unit of revenue. A key efficiency metric.
Formula:
ROS=(Operating Profit / Revenue) ×100
ros = (operating_profit / df["Revenue"].sum()) * 100
print("Return on Sales (ROS) %:", round(ros, 2))
10.EBITDA Margin
Definition:
Earnings before interest, taxes, depreciation, and amortization — shows operational profitability.
Formula:
EBITDA Margin %=(EBITDA / Revenue) ×100
depreciation = 0.05 * df["Revenue"].sum() # assume 5% of revenue
ebitda = operating_profit + depreciation
ebitda_margin = (ebitda / df["Revenue"].sum()) * 100
print("EBITDA Margin %:", round(ebitda_margin, 2))
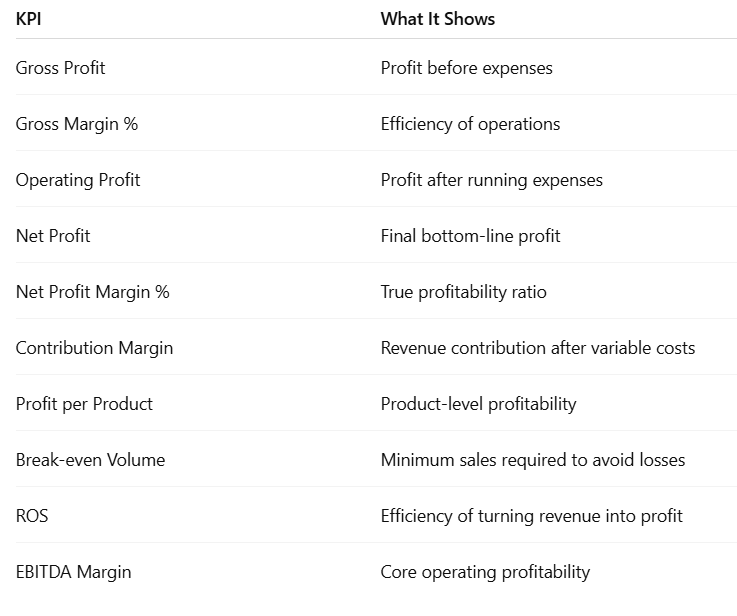
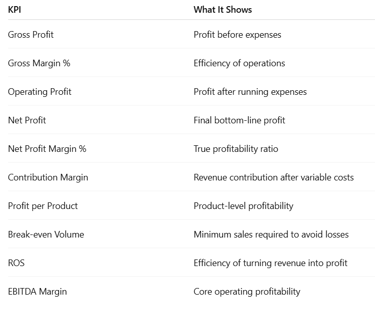
Summary
Let's Get in Touch
marketing@deepaiautomation.com
+91 6309397994
© 2025. All rights reserved.
Industries
Manufacturing
Financial Services
Retail
Solutions
DocuMind AI - Intelligent Document Migration
InsightEdge AI - Intelligent Power BI Reporting & Analytics
DCT AI - Digital Control Tower for Intelligent Enterprise Visibility
Inventra AI - Intelligent Inventory Optimization Platform
Maintenix AI - Predictive Maintenance Intelligence Platform
PayPredict AI - Intelligent Customer Payment Prediction Platform
SegMind AI - Intelligent Customer Segmentation & RFM Analytics Platform
DataForge AI - Intelligent ETL & Analytics Modernization Platform
DataSense AI - Intelligent Data Quality & Outlier Detection Agent