Sales Data Analysis - Pricing, Discounts & Promotions KPIs with Python
Blog post description.
10/3/20255 min read


Pricing and discount strategies play a critical role in shaping revenue and profitability. While discounts and promotions can boost sales, they can also erode margins if not tracked properly.
In this post, we’ll walk through 10 key Pricing & Promotion KPIs, explain what they mean, and implement them in Python using a sales dataset.
Generate a Sample Sales Dataset
Before diving into KPIs, let’s create a realistic dataset with customers, sales reps, products, regions, and revenues.
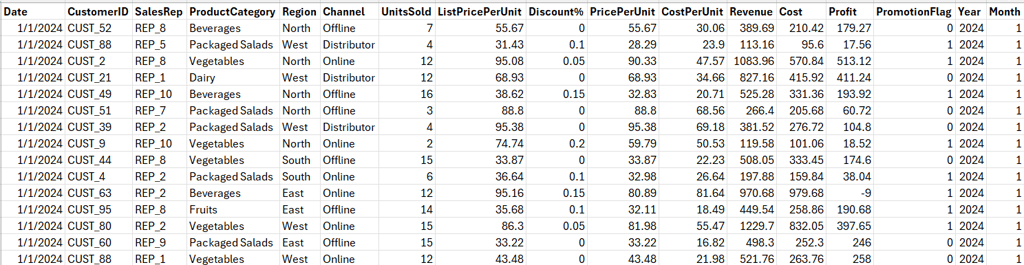
The description of some of the fields are given below:
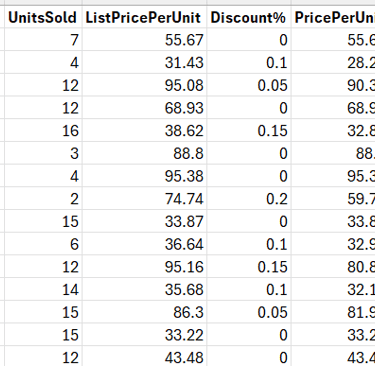
ListPricePerUnit → Original price before discount
Discount% → Percentage discount applied
CostPerUnit → Cost per unit is the total cost of producing one unit of a product or service.
CostPerUnit=Total Production Cost / Number of Units Produced
PricePerUnit → Final price after discount
PromotionFlag → 1 if the transaction was during a promotion, else 0
Revenue → UnitsSold × PricePerUnit
Cost → UnitsSold × CostPerUnit
Profit → Revenue – Cost
1.Average Discount %
Definition: Measures the average discount applied across all transactions. Insight: High average discount % may signal over-discounting and reduced profitability.
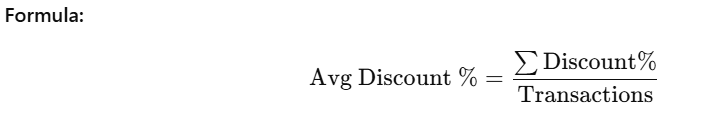
avg_discount_pct = df["Discount%"].mean()
print("Average Discount %:", round(avg_discount_pct, 2))
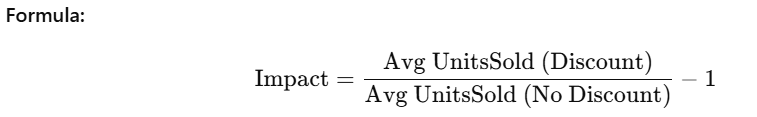
2.Discount Impact on Sales
Definition: Compares unit sales with and without discounts to measure effectiveness.
Insight: Positive impact means discounts successfully boosted sales.
discount_sales = df[df["Discount%"] > 0]["UnitsSold"].mean()
non_discount_sales = df[df["Discount%"] == 0]["UnitsSold"].mean()
discount_impact = ((discount_sales - non_discount_sales) / non_discount_sales) * 100
print("Discount Impact on Sales %:", round(discount_impact, 2))
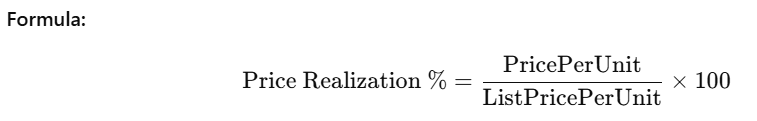
3.Price Realization %
Definition: The percentage of the list price actually realized after discounts.
Insight: Higher values show stronger pricing power.
df["PriceRealization%"] = (df["PricePerUnit"] / df["ListPricePerUnit"]) * 100
price_realization = df["PriceRealization%"].mean()
print("Price Realization %:", round(price_realization, 2))
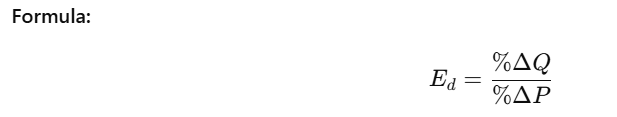
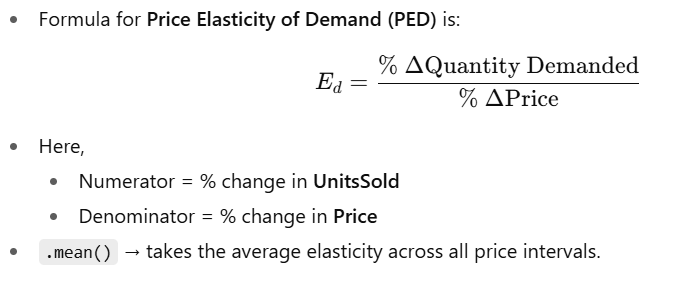
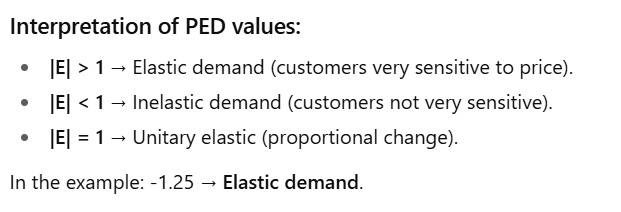
4.Price Elasticity of Demand
Definition: Measures sensitivity of demand to price changes. This code calculates Price Elasticity of Demand, which shows how sensitive sales volume is to price changes.
price_elasticity_data = df.groupby("PricePerUnit")["UnitsSold"].mean().pct_change()
price_changes = df["PricePerUnit"].pct_change()
elasticity = (price_elasticity_data / price_changes).mean()
print("Price Elasticity of Demand:", round(elasticity, 2))
Code Explanation:
df.groupby("PricePerUnit")["UnitsSold"].mean()
Groups the dataset by PricePerUnit.
For each price level, computes the average UnitsSold.
Effect: Shows the demand (units sold) at each price point.
.pct_change()
.pct_change() calculates the percentage change between successive values.
So:
price_elasticity_data = % change in UnitsSold when price changes.
price_changes = % change in PricePerUnit itself.
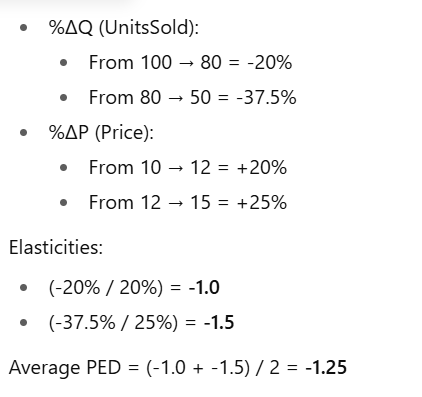
elasticity = (price_elasticity_data / price_changes).mean()
Example:
Suppose you have:
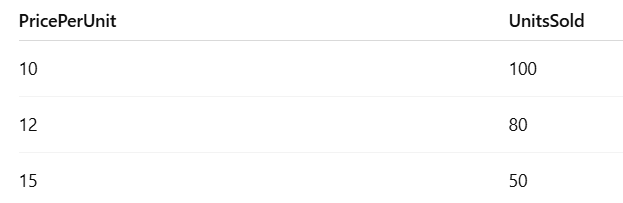

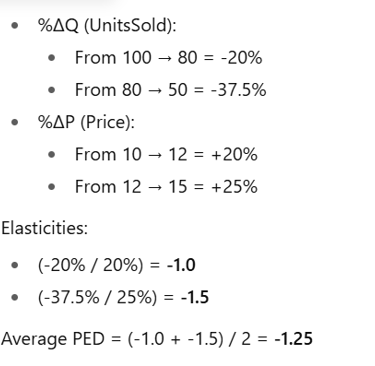
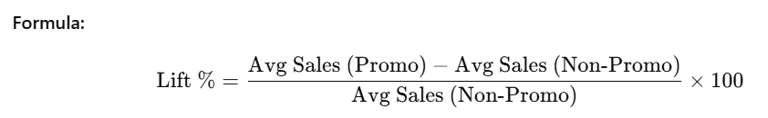
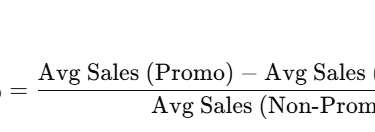
5.Promotional Lift %
Definition: Extra sales generated by promotions compared to non-promotions.
Insight: Positive lift % means promotions added incremental sales.
promo_sales = df[df["PromotionFlag"] == 1]["UnitsSold"].mean()
non_promo_sales = df[df["PromotionFlag"] == 0]["UnitsSold"].mean()
promo_lift = ((promo_sales - non_promo_sales) / non_promo_sales) * 100
print("Promotional Lift %:", round(promo_lift, 2))
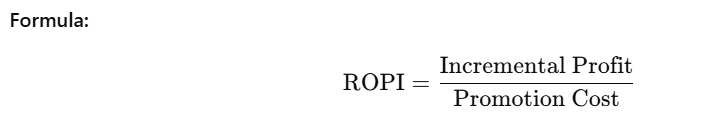
6.Return on Promotion Investment (ROPI)
Definition: Profit generated relative to cost of promotion.
Insight: ROPI > 1 means promotions are profitable.
#assume promo cost = 10% of promo revenue
promo_revenue = df[df["PromotionFlag"] == 1]["Revenue"].sum()
promo_profit = df[df["PromotionFlag"] == 1]["Profit"].sum()
baseline_profit = df[df["PromotionFlag"] == 0]["Profit"].mean() * len(df[df["PromotionFlag"] == 1])
incremental_profit = promo_profit - baseline_profit
promotion_cost = 0.1 * promo_revenue
ropi = incremental_profit / promotion_cost if promotion_cost != 0 else 0
print("ROPI:", round(ropi, 2))
Code Explanation:
Step 1: Promotion Revenue
promo_revenue = df[df["PromotionFlag"] == 1]["Revenue"].sum()
Filters rows where PromotionFlag == 1 (transactions during promotion).
Sums up Revenue.
This is the total revenue generated under promotion.
Step 2: Promotion Profit
promo_profit = df[df["PromotionFlag"] == 1]["Profit"].sum()
This is the total profit earned during promotion.
Step 3: Baseline Profit Estimate
baseline_profit = df[df["PromotionFlag"] == 0]["Profit"].mean() * len(df[df["PromotionFlag"] == 1])
Finds the average profit per transaction in non-promotion periods.
Multiplies by the number of promotion transactions.
This estimates how much profit you would have made without promotions (baseline).
Step 4: Incremental Profit
incremental_profit = promo_profit - baseline_profit
Measures how much extra profit the promotion generated compared to the baseline.
Positive → promotion added profit.
Negative → promotion hurt profit.
Step 5: Promotion Cost
promotion_cost = 0.1 * promo_revenue
Assumes promotions cost 10% of promotion revenue (e.g., discounts, marketing spend).
This is the investment cost of running the promotion.
Step 6: Return on Promotion Investment (ROPI)
ropi = incremental_profit / promotion_cost if promotion_cost != 0 else 0
If cost = 0 (edge case), return = 0 to avoid division error.
Interpretation of ROPI
ROPI > 1 → Promotions generated more profit than they cost → good.
ROPI = 1 → Break-even (no gain, no loss).
ROPI < 1 → Promotions were not worth it (lost money).
Quick Example
Suppose:
Promotion Revenue = ₹100,000
Promotion Profit = ₹20,000
Baseline Profit Estimate = ₹15,000
Incremental Profit = 20,000 - 15,000 = ₹5,000
Promotion Cost = 0.1 × 100,000 = ₹10,000
ROPI=5,000 / 10,000=0.5
Interpretation: For every ₹1 spent on promotions, only ₹0.50 profit came back → not effective.
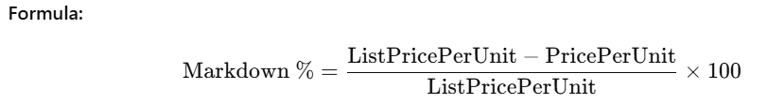
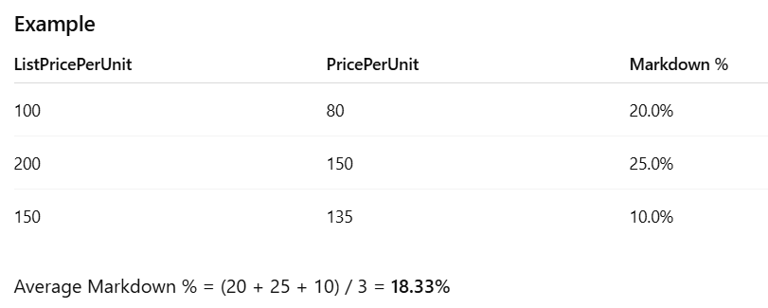
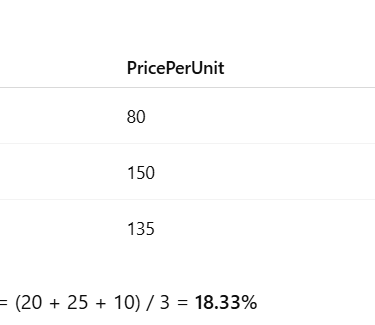
7.Markdown %
Definition: The percentage cut from list price to selling price. This is the average discount percentage given vs the original list price.
Insight: Useful in retail to measure clearance discounts.
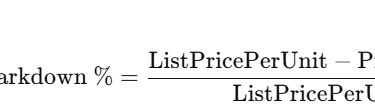
df["Markdown%"] = ((df["ListPricePerUnit"] - df["PricePerUnit"]) / df["ListPricePerUnit"]) * 100
markdown_pct = df["Markdown%"].mean()
print("Average Markdown %:", round(markdown_pct, 2))
ListPricePerUnit = the original price (before discounts).
PricePerUnit = the actual selling price (after discounts/promotions).
The difference = discount amount per unit.
you can use split markdown% by product category or promotion campaign (so you can see where you give the biggest discounts)?
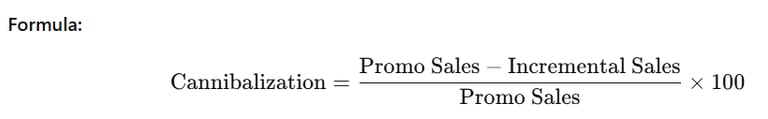
8.Sales Cannibalization Rate
Definition: Share of promotion sales that replaced existing sales, instead of adding new ones.
Insight: High cannibalization means promos just shifted purchases rather than growing sales.
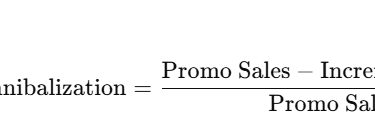
incremental_sales = promo_sales - non_promo_sales
cannibalization_rate = ((promo_sales - incremental_sales) / promo_sales) * 100
print("Sales Cannibalization Rate %:", round(cannibalization_rate, 2))
9.Average Selling Price (ASP)
Definition: Weighted average price realized per unit sold.
Insight: ASP reflects the balance between premium vs discounted sales.
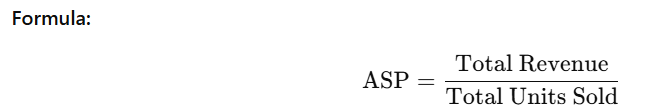
asp = df["Revenue"].sum() / df["UnitsSold"].sum()
print("Average Selling Price (ASP):", round(asp, 2))
10.Net Revenue per Unit (NRU)
Definition: Actual net revenue earned per unit after discounts.
Insight: Helps evaluate how much revenue is realized per unit, considering discounts.
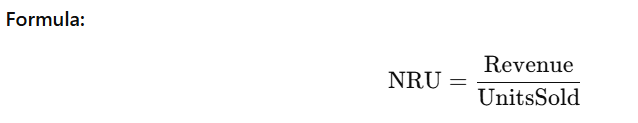
nru = df["Revenue"].sum() / df["UnitsSold"].sum()
print("Net Revenue per Unit (NRU):", round(nru, 2))
Final Thoughts
Discounts and promotions can drive growth, but they also come with risks. Tracking these KPIs ensures:
Sustainable pricing power (Price Realization %, ASP, NRU)
Efficient discount strategies (Avg Discount %, Markdown %)
Effective promotions (Promo Lift %, ROPI, Cannibalization)
Customer response to price changes (Price Elasticity)
Together, these KPIs empower businesses to strike the right balance between sales growth and profitability.
Let's Get in Touch
marketing@deepaiautomation.com
+91 6309397994
© 2025. All rights reserved.
Industries
Manufacturing
Financial Services
Retail
Solutions
DocuMind AI - Intelligent Document Migration
InsightEdge AI - Intelligent Power BI Reporting & Analytics
DCT AI - Digital Control Tower for Intelligent Enterprise Visibility
Inventra AI - Intelligent Inventory Optimization Platform
Maintenix AI - Predictive Maintenance Intelligence Platform
PayPredict AI - Intelligent Customer Payment Prediction Platform
SegMind AI - Intelligent Customer Segmentation & RFM Analytics Platform
DataForge AI - Intelligent ETL & Analytics Modernization Platform
DataSense AI - Intelligent Data Quality & Outlier Detection Agent