Sales Data Analysis - Sales Productivity KPIs with Pyhon
10/4/20254 min read


Sales teams thrive on performance visibility. Knowing which reps close deals faster, convert more leads, or manage a healthy pipeline helps sales leaders optimize strategy and forecasting.
In this post, we’ll cover the top 10 Sales Productivity KPIs, explain each one, and show you exactly how to calculate them in Python.
Dataset Description:
Date → The transaction or sale date
CustomerID → A unique identifier for each customer
SalesRep → Name or ID of the salesperson responsible for the sale.
ProductCategory → Category or classification of the product sold
Region → The geographical area or sales territory where the sale occurred.
Channel → The sales channel through which the transaction occurred (e.g., Retail, Online, Distributor, Wholesale).
UnitsSold → The total number of units sold in the transaction. Used for computing volume-based metrics like revenue per unit, profit per unit, etc.
ListPricePerUnit → Original price before discount
Discount% → Percentage discount applied
CostPerUnit → Cost per unit is the total cost of producing one unit of a product or service.
CostPerUnit=Total Production Cost / Number of Units Produced
PricePerUnit → Final price after discount
PromotionFlag → 1 if the transaction was during a promotion, else 0
Revenue → UnitsSold × PricePerUnit
Cost → UnitsSold × CostPerUnit
Profit → Revenue – Cost
Quota → Monthly/quarterly quota assigned to each rep
Leads → Number of leads handled by each rep
Opportunities → Number of qualified opportunities
DealsClosed → Number of deals won
CloseDate and StartDate → For calculating sales cycle
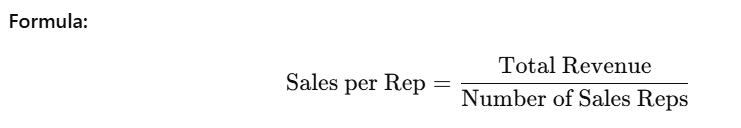
1.Sales per Rep
Definition: Measures total revenue generated by each salesperson.
Insight: Shows top-performing reps and helps identify underperformers.
sales_per_rep = df.groupby("SalesRep")["Revenue"].sum().reset_index()
print(sales_per_rep)
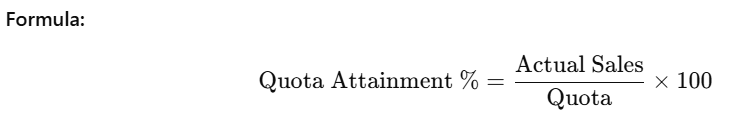
2.Quota Attainment %
Definition: The percentage of sales achieved relative to the sales quota.
Insight: A key performance indicator in incentive and compensation planning.
quota_df = pd.DataFrame({
"SalesRep": ["A", "B", "C"],
"Revenue": [120000, 90000, 150000],
"Quota": [100000, 100000, 150000]
})
quota_df["QuotaAttainment%"] = (quota_df["Revenue"] / quota_df["Quota"]) * 100
print(quota_df)
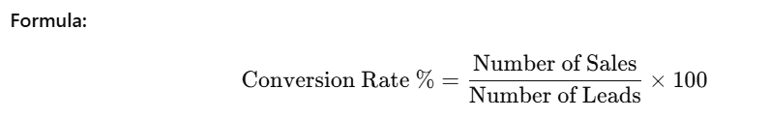
3.Lead-to-Sale Conversion Rate
Definition: Measures how effectively leads are converted into paying customers.
Insight: Helps evaluate the quality of leads and sales effectiveness.
conversion_df = pd.DataFrame({
"SalesRep": ["A", "B", "C"],
"Leads": [100, 80, 150],
"DealsClosed": [20, 15, 30]
})
conversion_df["LeadToSaleConversion%"] = (conversion_df["DealsClosed"] / conversion_df["Leads"]) * 100
print(conversion_df)
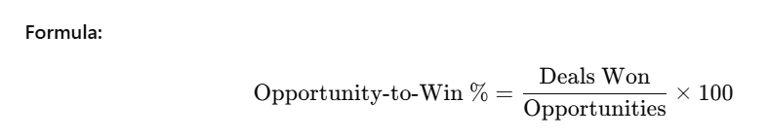
4.Opportunity-to-Win Ratio
Definition: Compares the number of opportunities pursued to the number of deals won.
Insight: A high ratio indicates strong closing skills and an efficient sales funnel.
opportunity_df = pd.DataFrame({
"SalesRep": ["A", "B", "C"],
"Opportunities": [50, 60, 70],
"DealsClosed": [25, 30, 35]
})
opportunity_df["OpportunityToWin%"] = (opportunity_df["DealsClosed"] / opportunity_df["Opportunities"]) * 100
print(opportunity_df)
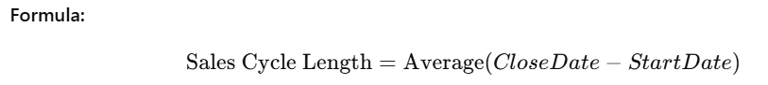
5.Sales Cycle Length (Days to Close)
Definition: Average number of days it takes to close a deal from opportunity creation.
Insight: Shorter cycles imply faster conversions and higher productivity.
df["StartDate"] = pd.to_datetime(df["Date"]) # assuming Date = start
df["CloseDate"] = df["StartDate"] + pd.to_timedelta(np.random.randint(10, 60, len(df)), unit="D")
df["SalesCycleDays"] = (df["CloseDate"] - df["StartDate"]).dt.days
avg_cycle_length = df["SalesCycleDays"].mean()
print("Average Sales Cycle Length (days):", round(avg_cycle_length, 2))
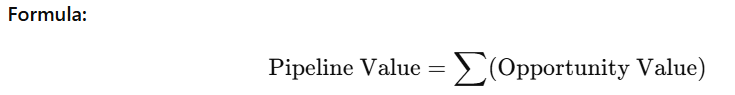
6.Pipeline Value
Definition: Total value of all active opportunities in the sales pipeline.
Insight: Represents the total potential revenue in progress.
pipeline_df = pd.DataFrame({
"SalesRep": ["A", "B", "C"],
"OpportunityValue": [200000, 150000, 180000]
})
pipeline_value = pipeline_df["OpportunityValue"].sum()
print("Total Pipeline Value:", pipeline_value)
7.Pipeline Coverage Ratio
Definition: Ratio of pipeline value to the sales target (quota).
Insight: Ideal coverage is typically 3–4x quota to ensure consistent performance.
pipeline_df["Quota"] = [100000, 100000, 150000]
pipeline_df["PipelineCoverageRatio"] = pipeline_df["OpportunityValue"] / pipeline_df["Quota"]
8.Win Rate %
Definition: Measures how many opportunities convert into actual deals.
Insight: A key metric to track overall sales effectiveness and team performance.
win_rate = (opportunity_df["DealsClosed"].sum() / opportunity_df["Opportunities"].sum()) * 100
9.Average Deal Size
Definition: The average revenue generated per closed deal.
Insight: Useful for forecasting and understanding the value of each sale.
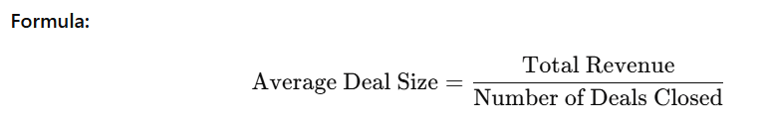
total_revenue = df["Revenue"].sum()
total_deals = 200 # example
avg_deal_size = total_revenue / total_deals
10.Number of Deals Closed
Definition: Total number of successful sales closed within a period.
Insight: Core metric to evaluate productivity and goal achievement.


deals_closed = len(df[df["Revenue"] > 0]) # assuming non-zero revenue means closed
Key Takeaways
Tracking Sales Productivity KPIs helps businesses answer critical questions like:
Who are the most productive reps?
How long does it take to close a deal?
Is the pipeline sufficient to meet revenue goals?
Let's Get in Touch
marketing@deepaiautomation.com
+91 6309397994
© 2025. All rights reserved.
Industries
Manufacturing
Financial Services
Retail
Solutions
DocuMind AI - Intelligent Document Migration
InsightEdge AI - Intelligent Power BI Reporting & Analytics
DCT AI - Digital Control Tower for Intelligent Enterprise Visibility
Inventra AI - Intelligent Inventory Optimization Platform
Maintenix AI - Predictive Maintenance Intelligence Platform
PayPredict AI - Intelligent Customer Payment Prediction Platform
SegMind AI - Intelligent Customer Segmentation & RFM Analytics Platform
DataForge AI - Intelligent ETL & Analytics Modernization Platform
DataSense AI - Intelligent Data Quality & Outlier Detection Agent