Sales Data Analysis - The Most Important Customer Metrics Every Business Should Track
10/4/20254 min read


Customers are the heart of every business. Understanding how much value each customer brings, how much it costs to acquire them, and how long they stay loyal is vital for sustainable growth.
In this post, we’ll cover essential customer metrics, complete with definitions, formulas, and Python code examples.
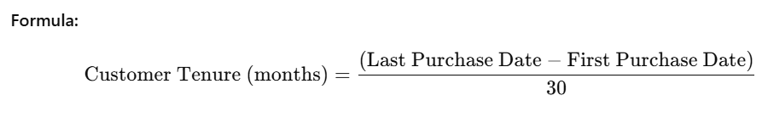
1.Customer Tenure (Months)
Tracks how long customers have been with your business.
It helps identify long-term loyal customers and segment churn risks.
df['CustomerTenureMonths'] = (df['LastPurchaseDate'] - df['FirstPurchaseDate']).dt.days / 30
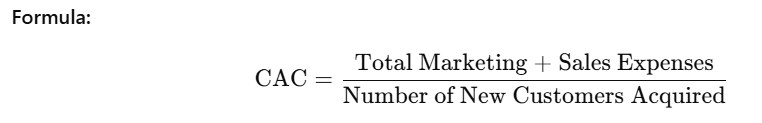
2. CAC - Customer Acquisition Cost
Definition:
The total marketing and sales expenses spent to acquire a new customer.
3. RepeatPurchaseFlag
Definition:
A binary flag indicating whether a customer made more than one purchase (1 = repeat, 0 = one-time buyer).
Logic:
If NumberOfPurchases > 1 → RepeatPurchaseFlag = 1, else 0.
purchase_data = {
'CustomerID': [101, 102, 103, 104],
'NumberOfPurchases': [5, 1, 3, 2]
}
df2 = pd.DataFrame(purchase_data)
df2['RepeatPurchaseFlag'] = df2['NumberOfPurchases'].apply(lambda x: 1 if x > 1 else 0)
print(df2)
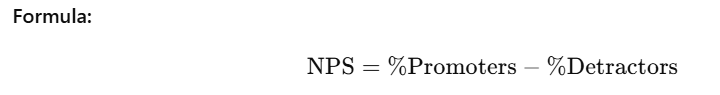
4. NPSScore (Net Promoter Score)
Definition:
A customer satisfaction metric that measures how likely customers are to recommend your product or service.
Customers rate from 0 to 10:
0–6 → Detractors
7–8 → Passives
9–10 → Promoters
import pandas as pd
nps_data = {
'CustomerID': [101, 102, 103, 104, 105],
'NPSRating': [10, 8, 9, 6, 7]
}
df3 = pd.DataFrame(nps_data)
def categorize_nps(score):
if score >= 9:
return 'Promoter'
elif score >= 7:
return 'Passive'
else:
return 'Detractor'
df3['Category'] = df3['NPSRating'].apply(categorize_nps)
promoters = (df3['Category'] == 'Promoter').mean() * 100
detractors = (df3['Category'] == 'Detractor').mean() * 100
nps = promoters - detractors
print(df3)
print(f"Net Promoter Score (NPS): {nps:.2f}")
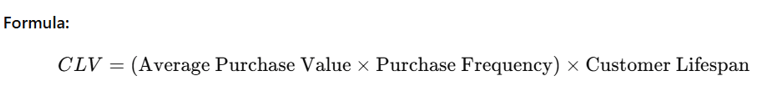
5.Customer Lifetime Value (CLV)
Definition:
Customer Lifetime Value (CLV) is the total revenue (or profit) a business can expect to earn from a single customer over the entire period of their relationship.
Insight: Helps you focus marketing on high-value, long-term customers.
import pandas as pd
# Example data
data = {
"CustomerID": ["C1", "C2", "C3"],
"Revenue": [12000, 8000, 20000],
"Orders": [4, 2, 5],
"TenureMonths": [12, 6, 24]
}
df = pd.DataFrame(data)
# Step 1: Calculate average purchase value
df["AvgPurchaseValue"] = df["Revenue"] / df["Orders"]
# Step 2: Calculate purchase frequency per month
df["PurchaseFreq"] = df["Orders"] / df["TenureMonths"]
# Step 3: Estimate monthly CLV (AvgPurchaseValue × PurchaseFreq)
df["MonthlyCLV"] = df["AvgPurchaseValue"] * df["PurchaseFreq"]
# Step 4: Estimate Customer Lifetime Value (assuming customer continues for 12 more months)
df["CLV"] = df["MonthlyCLV"] * 12
print(df[["CustomerID", "AvgPurchaseValue", "PurchaseFreq", "CLV"]])
total_marketing_spend = 100000
new_customers = df["CustomerID"].nunique()
CAC = total_marketing_spend / new_customers
print("Customer Acquisition Cost (CAC):", round(CAC, 2))
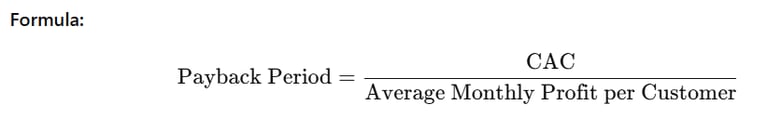
6.CAC Payback Period
Definition:
The time required to recover the cost of acquiring a customer through generated profit.
Insight: A shorter payback period means faster ROI from acquisition efforts.
avg_monthly_profit = df.groupby("CustomerID")["Profit"].mean().mean()
payback_period = CAC / avg_monthly_profit
print("CAC Payback Period (months):", round(payback_period, 2))
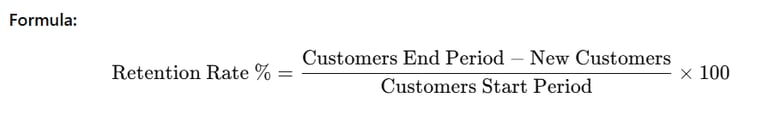
7.Customer Retention Rate
Definition:
Percentage of customers retained over a specific time period.
Insight: Retention is cheaper and more profitable than constant new acquisition.
customers_start = 400
customers_end = 480
new_customers = 100
retention_rate = ((customers_end - new_customers) / customers_start) * 100
print("Customer Retention Rate %:", round(retention_rate, 2))
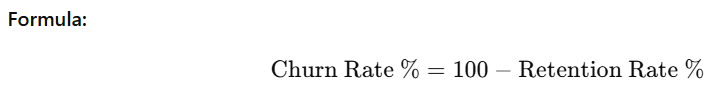
8.Customer Churn Rate
Definition:
The percentage of customers lost during a given period.
9.Upsell / Cross-sell Revenue
Definition:
Revenue generated from selling higher-value products (upsell) or complementary products (cross-sell).
Insight: Indicates how effectively you’re monetizing your customer base.

baseline_revenue = df.groupby("CustomerID")["Revenue"].first().sum()
actual_revenue = df.groupby("CustomerID")["Revenue"].sum().sum()
upsell_revenue = actual_revenue - baseline_revenue
print("Upsell/Cross-sell Revenue:", round(upsell_revenue, 2))
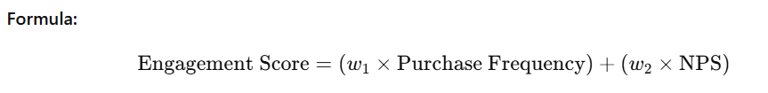
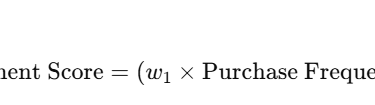
10.Customer Engagement Score
Definition:
A composite score measuring customer interaction (e.g., purchases, website visits, feedback).
Insight: Higher scores show stronger emotional and behavioral connection.
engagement_df = df.groupby("CustomerID").agg({
"Revenue": "count", "NPSScore": "mean"
}).reset_index()
engagement_df["EngagementScore"] = (0.6 engagement_df["Revenue"]) + (0.4 engagement_df["NPSScore"])
print(engagement_df.head())
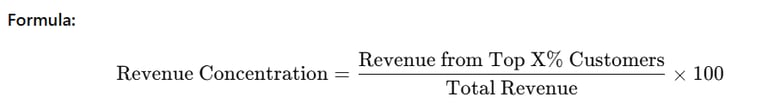
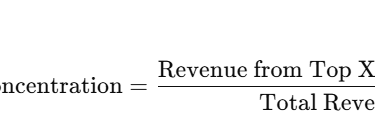
11.Customer Revenue Concentration
Definition:
Measures dependency on top customers for total revenue.
Insight: High concentration risk means revenue depends on a few key clients.
customer_revenue = df.groupby("CustomerID")["Revenue"].sum().sort_values(ascending=False)
top_10pct = int(0.1 * len(customer_revenue))
top_revenue = customer_revenue.head(top_10pct).sum()
total_revenue = customer_revenue.sum()
concentration = (top_revenue / total_revenue) * 100
print("Customer Revenue Concentration %:", round(concentration, 2))
Let's Get in Touch
marketing@deepaiautomation.com
+91 6309397994
© 2025. All rights reserved.
Industries
Manufacturing
Financial Services
Retail
Solutions
DocuMind AI - Intelligent Document Migration
InsightEdge AI - Intelligent Power BI Reporting & Analytics
DCT AI - Digital Control Tower for Intelligent Enterprise Visibility
Inventra AI - Intelligent Inventory Optimization Platform
Maintenix AI - Predictive Maintenance Intelligence Platform
PayPredict AI - Intelligent Customer Payment Prediction Platform
SegMind AI - Intelligent Customer Segmentation & RFM Analytics Platform
DataForge AI - Intelligent ETL & Analytics Modernization Platform
DataSense AI - Intelligent Data Quality & Outlier Detection Agent