Top 10 Revenue & Growth KPIs for Sales Data Analysis with Python
Kishore Babu Valluri
10/3/20256 min read


Sales teams and business leaders often talk about revenue growth, but few know how to measure it properly. With the right KPIs (Key Performance Indicators), you can track business health, optimize sales strategies, and identify growth opportunities.
In this post, we’ll walk through the Top 10 Revenue & Growth KPIs, their formulas, and how to calculate and visualize them using Python (pandas + matplotlib). We’ll also generate a sample sales dataset so you can try it yourself.
Generate a Sample Sales Dataset
Before diving into KPIs, let’s create a realistic dataset with customers, sales reps, products, regions, and revenues.
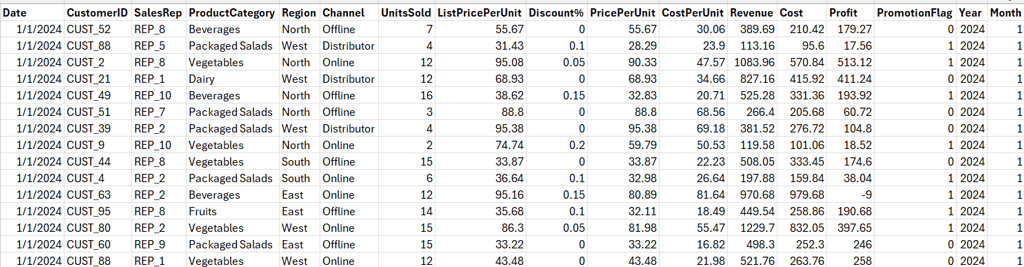
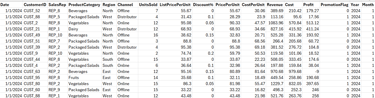
The description of some of the fields are given below:
ListPricePerUnit → Original price before discount
Discount% → Percentage discount applied
PricePerUnit → Final price after discount
PromotionFlag → 1 if the transaction was during a promotion, else 0
Revenue → UnitsSold × PricePerUnit
Cost → UnitsSold × CostPerUnit
Profit → Revenue – Cost
1. Total Sales Revenue
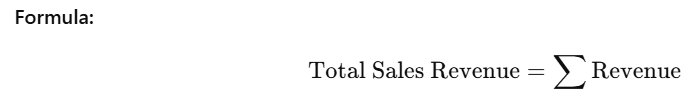
total_revenue = df["Revenue"].sum()
print("Total Revenue:", round(total_revenue, 2))
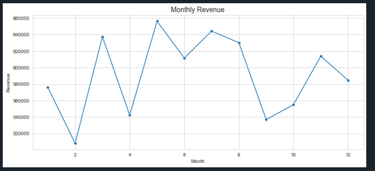
2. Revenue Growth Rate (MoM)

monthly_revenue = df.groupby("Month")["Revenue"].sum()
monthly_growth = monthly_revenue.pct_change() * 100
Code Explanation:
Step 1: df.groupby("Month")["Revenue"].sum()
df.groupby("Month") → Groups your dataset by the column Month.
["Revenue"] → Selects only the Revenue column from the grouped data.
.sum() → Sums up the revenues for each month.
Result:
You get a Series where the index is Month and the values are the total revenue per month.

Step 2: monthly_revenue.pct_change()
pct_change() calculates the percentage change between the current and previous row.
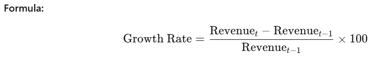
Formula:

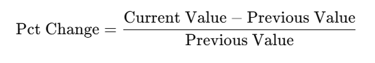
For revenue:
Feb Growth = (Feb Revenue − Jan Revenue) ÷ Jan Revenue
Mar Growth = (Mar Revenue − Feb Revenue) ÷ Feb Revenue
So, it tells you how much the revenue has grown or shrunk compared to the previous month.
Step 3: * 100
Converts the decimal percentage into a percentage value.
Example:
Growth = 0.20 → 20%
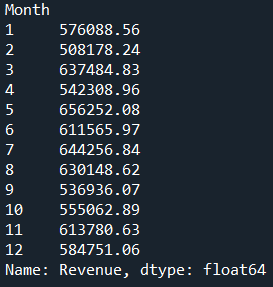
If monthly_revenue is:
Jan 576088.56
Feb 508178.24
Mar 637484.83
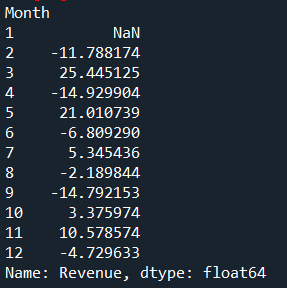
Then monthly_growth becomes:
Jan NaN # no previous month to compare
Feb -11.78 # (508178.24-576088.56)/576088.56 * 100
Mar 25.44 # (637484.83-508178.24)/508178.24 * 100
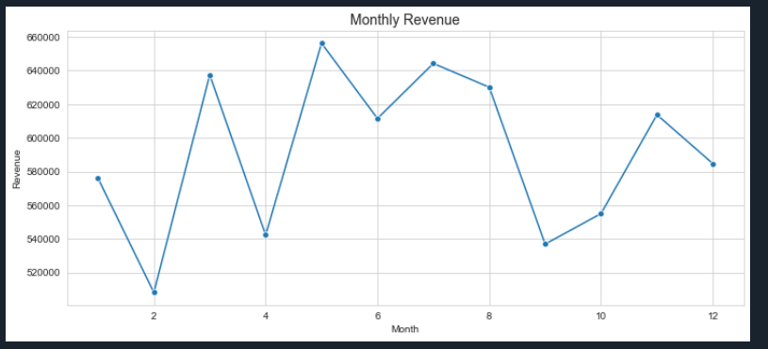
Visualization
import matplotlib.pyplot as plt
import seaborn as sns
# Set style
sns.set_style("whitegrid")
# Plot Monthly Revenue
plt.figure(figsize=(12,5))
sns.lineplot(x=monthly_revenue.index, y=monthly_revenue.values, marker="o")
plt.title("Monthly Revenue", fontsize=14)
plt.xlabel("Month")
plt.ylabel("Revenue")
plt.show()
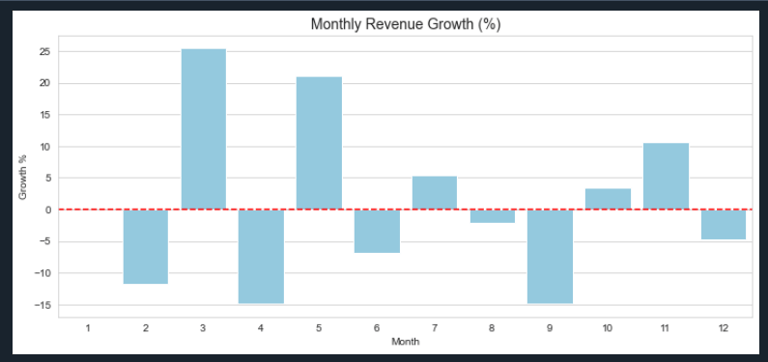
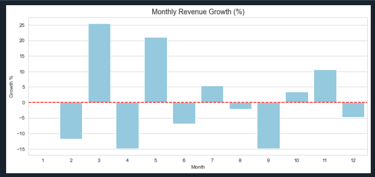
# Plot Monthly Growth %
plt.figure(figsize=(12,5))
sns.barplot(x=monthly_growth.index, y=monthly_growth.values, color="skyblue")
plt.axhline(0, color="red", linestyle="--") # zero-growth line
plt.title("Monthly Revenue Growth (%)", fontsize=14)
plt.xlabel("Month")
plt.ylabel("Growth %")
plt.show()
3. Revenue per Customer (ARPC)
arpc = df.groupby("CustomerID")["Revenue"].sum().mean()
print("ARPC:", round(arpc, 2))
Code Explanation:
Step 1: df.groupby("CustomerID")
Groups your dataset by each CustomerID.
Meaning: all transactions belonging to the same customer will be grouped together.
Step 2: ["Revenue"].sum()
For each CustomerID, sum up all the revenues (purchases) made by that customer.
This gives Total Revenue per Customer.
Example:
If your data looks like:
CustomerID Revenue
C1 100
C1 200
C2 300
C3 400
C3 100
After grouping + summing:
CustomerID
C1 300 # (100 + 200)
C2 300
C3 500 # (400 + 100)
Step 3: .mean()
Takes the average of these totals.
This is called Average Revenue per Customer (ARPC).
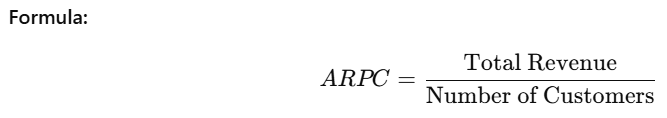
Formula:
ARPC=Total Revenue / Number of Customers
ARPC=3300+300+500=366.67
Step 4: round(arpc, 2)
Rounds the result to 2 decimal places for cleaner display.
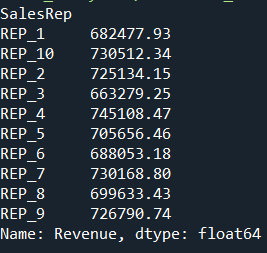
4. Revenue per Sales Rep
Highlights top-performing sales representatives.
revenue_per_rep = df.groupby("SalesRep")["Revenue"].sum()
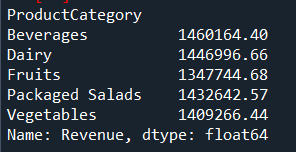
5. Revenue by Product/Category
Shows which products contribute most to sales.
revenue_by_product = df.groupby("ProductCategory")["Revenue"].sum()

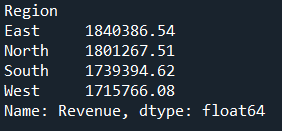
6. Revenue by Region/Channel
Helps identify strong and weak regions/channels.
revenue_by_region = df.groupby("Region")["Revenue"].sum()
revenue_by_channel = df.groupby("Channel")["Revenue"].sum()

7. Monthly Recurring Revenue (MRR)
Key metric for subscription-based businesses.
mrr = df.groupby(["Year","Month","CustomerID"])["Revenue"].sum().groupby(["Year","Month"]).mean()
Code Explanation:
Step 1: df.groupby(["Year","Month","CustomerID"])["Revenue"].sum()
Groups your data by Year, Month, and CustomerID.
For each customer in each month, it sums their revenue.
Effect: You get Total Revenue per Customer per Month.
Example:
Year Month CustomerID Revenue
2025 Jan C1 100
2025 Jan C2 150
2025 Feb C1 200
2025 Feb C2 250
Step 2: .groupby(["Year","Month"]).mean()
Now we group again, but only by Year and Month.
Then we take the mean across all customers for that month.
Effect: You get the average revenue per customer for each month (i.e., MRR).
Formula:
MRR=Total Revenue in that month / Number of Active Customers in that month
In short:
First grouping → Customer-level revenue per month.
Second grouping → Average of those customer revenues → Monthly Recurring Revenue per customer (MRR).
Quick check:
If Jan 2025 revenue is: C1=100, C2=150 → average = 125
If Feb 2025 revenue is: C1=200, C2=250 → average = 225
So MRR shows how much, on average, each customer brings in monthly.
8. Annual Recurring Revenue (ARR)
ARR=MRR×12
Projects yearly recurring income.
arr = mrr.mean() * 12
print("ARR:", round(arr, 2))
9. New Business Revenue
Revenue from newly acquired customers. It is all about finding new business revenue (revenue from customers making their very first purchase).
first_purchase = df.groupby("CustomerID")["Date"].min()
df["FirstPurchaseDate"] = df["CustomerID"].map(first_purchase)
new_business = df[df["Date"] == df["FirstPurchaseDate"]].groupby("Month")["Revenue"].sum()
Code Explanation:
first_purchase = df.groupby("CustomerID")["Date"].min()
Groups transactions by CustomerID.
Picks the earliest (minimum) Date for each customer.
Result: A mapping of each customer → their first purchase date.
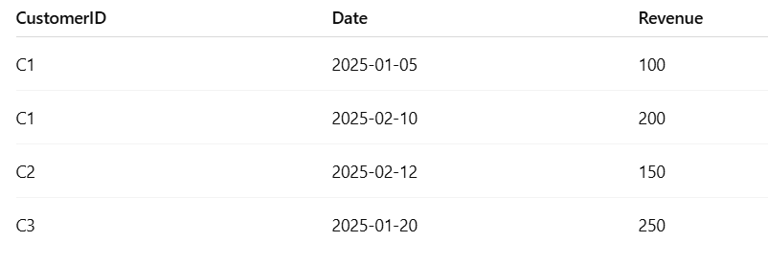
Example:
CustomerID
C1 2025-01-05
C2 2025-02-12
C3 2025-01-20
Step 2:
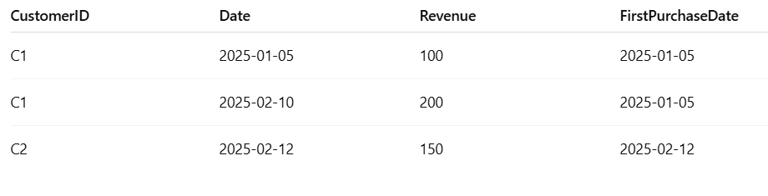
df["FirstPurchaseDate"] = df["CustomerID"].map(first_purchase)
Adds a new column FirstPurchaseDate to the main dataframe.
For every row (transaction), it maps the customer’s first purchase date.

Step 3:
new_business = df[df["Date"] == df["FirstPurchaseDate"]].groupby("Month")["Revenue"].sum()
Filters the dataframe to keep only rows where the purchase date equals the first purchase date.
(i.e., the first-ever transaction of each customer).Groups these first-time purchases by Month.
Sums the Revenue.
Effect: Gives you New Business Revenue per Month (how much revenue came from new customers in their first purchase month).
Then:
First purchases → C1 (Jan), C2 (Feb), C3 (Jan).
New Business Revenue per month:
Jan = 100 + 250 = 350
Feb = 150 = 150
So new_business will look like:
Month
Jan 350
Feb 150
Name: Revenue, dtype: int64
In short:
This code finds when each customer first bought something, and then sums up the revenue from first-time purchases, grouped by month → New Business Revenue trend.
10. Repeat Business Revenue
Revenue from existing customers (loyalty measure).
repeat_business = df[df["Date"] > df["FirstPurchaseDate"]].groupby("Month")["Revenue"].sum()
Code Explanation:
Step 1:
df["Date"] > df["FirstPurchaseDate"]
For each row (transaction), it checks:
Is this purchase date later than the customer’s first purchase date?True → it’s a repeat purchase (not the first one).
False → it’s the first purchase (already captured in new_business).
Step 2:
df[df["Date"] > df["FirstPurchaseDate"]]
Filters the dataframe to include only repeat transactions.
So now the dataset contains only purchases made after the first purchase date.
Step 3:
.groupby("Month")["Revenue"].sum()
Groups those repeat purchases by Month.
Sums up their Revenue.
Effect: This gives Repeat Business Revenue per Month (money coming from existing customers after their first purchase).
Example
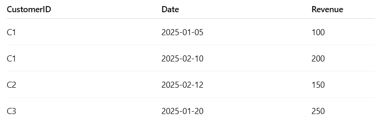
If your dataset looks like:

First purchases (new business):
Jan: C1=100, C3=250 → 350
Feb: C2=150
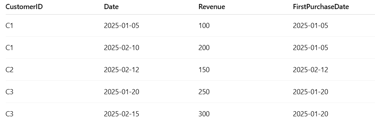
Repeat purchases (repeat business):
Feb: C1=200, C3=300 → 500
So repeat_business will look like:
Month
Feb 500
Name: Revenue, dtype: int64
In short:
new_business → revenue from first-time customers.
repeat_business → revenue from returning customers.
Together, they split total monthly revenue into growth from new customers vs retention of existing ones.
Let's Get in Touch
marketing@deepaiautomation.com
+91 6309397994
© 2025. All rights reserved.
Industries
Manufacturing
Financial Services
Retail
Solutions
DocuMind AI - Intelligent Document Migration
InsightEdge AI - Intelligent Power BI Reporting & Analytics
DCT AI - Digital Control Tower for Intelligent Enterprise Visibility
Inventra AI - Intelligent Inventory Optimization Platform
Maintenix AI - Predictive Maintenance Intelligence Platform
PayPredict AI - Intelligent Customer Payment Prediction Platform
SegMind AI - Intelligent Customer Segmentation & RFM Analytics Platform
DataForge AI - Intelligent ETL & Analytics Modernization Platform
DataSense AI - Intelligent Data Quality & Outlier Detection Agent